Getting Started Guide
PingPlotter Menus
Who doesn’t like a good menu?
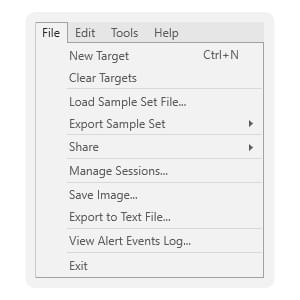
File Menu

New Target
Create a new empty target area.Clear Targets
Clear the target area for a new trace.Load Sample Set File...
Load a PingPlotter data set (.pp2) into PingPlotter.Export Sample Set
Save your collected trace data as a .pp2 file for sending to your favorite IT professional.Share
Create a shareable webpage with screenshots and sample set data for your current trace.Manage Sessions...
Open the Session Manager window, which will list your current and most recent PingPlotter trace sessions. From here, you can jump between PingPlotter traces and manage previous session data.Save Image…
Save the current target window graph in your favorite flavor of image file for easy sharing.Export to Text File…
Export the current target window’s trace data to a .csv file for pleasant distribution.View Alert Events Log...
Open a detailed log of triggered alerts. You probably won’t need this right now.Exit
Does what it says on the tin. Don’t worry if you hit this accidentally. By default, PingPlotter saves your data automatically after five minutes of runtime.
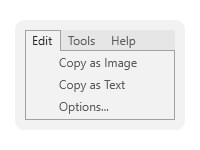
Edit Menu

Copy as Image
Copy an image of the current timeline window graph to the clipboard for easy pasting.Copy as Text
Copy a text version of the current timeline window’s graph data to the clipboard for easy pasting.Options...
Pull up the PingPlotter options and settings menu. It’s probably best you leave things as-is for now, but it never hurts to take a peek.

