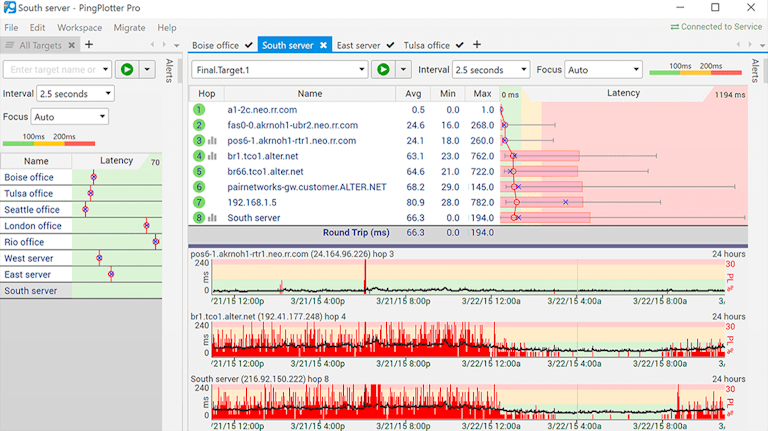
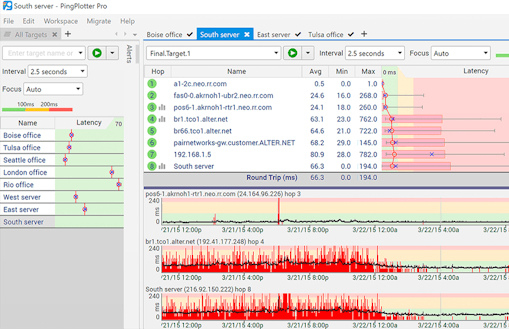
Ping & Traceroute Monitoring
Test network routes and immediately recognize the source of problems when important websites and internet services need troubleshooting attention.
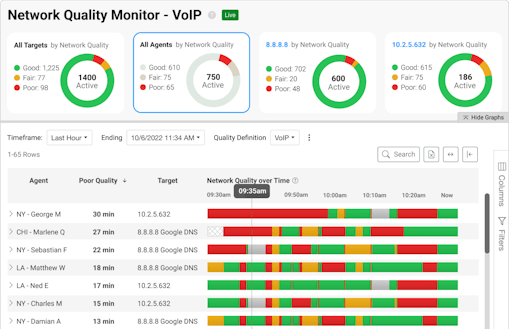
Latency, Packet Loss, & Jitter
Measure trusted metrics and share meaningful data with stakeholders.
Notifications & Automations
Alert the moment problems happen and integrate with other systems.
Shareable Reports
Show results to anyone by posting online or exporting snapshots.
Summary Views
Identify problematic routes quickly with an at-a-glance overview.
Local Network Discovery
Scan your network and list every connected device.