Customer Reviews
Excellent Diagnostic Tool for Business Applications"
- Admin in Industrial Automation
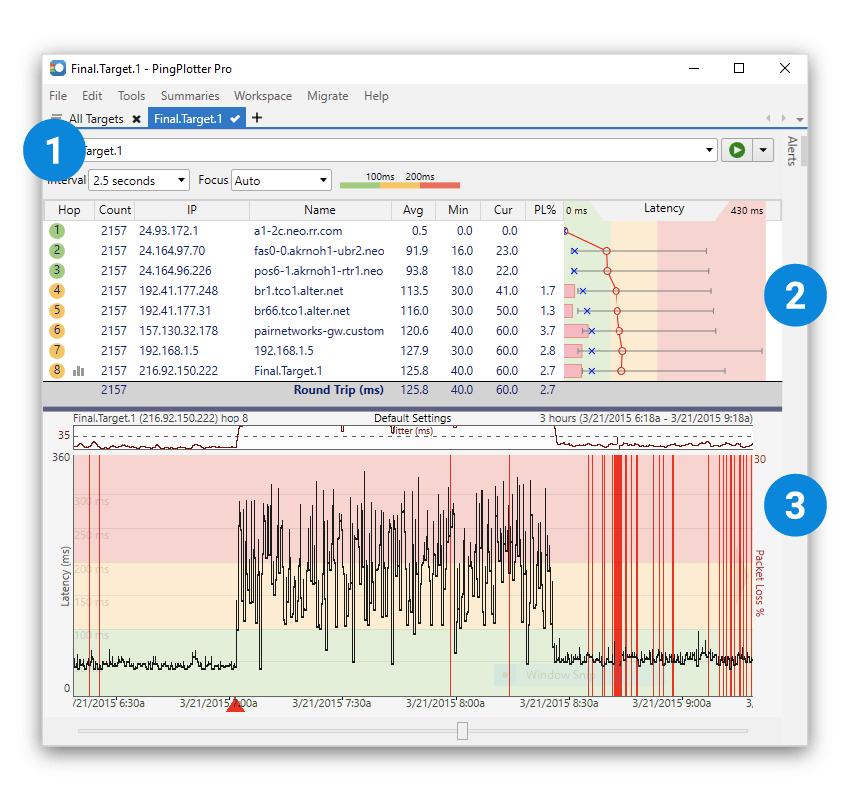
Read full reviewPingPlotter graphs make it easier to see if packet loss and latency are caused by your local network, the service you're accessing, or something in between. Try it free for 14 days.
Test the route to any server, website, or host.
Visual diagnostics for every device between you and your destination.
Plot performance over time and share the results in an easy-to-read format.
Get Started Fast
All it takes is downloading PingPlotter, entering a target, and clicking the trace button.
See Granular Data
Ping the network every second (or less) to capture tiny variations in network performance.
Prove the Culprit
Share visual proof of network bottlenecks with anyone who can open an attachment or click a link.
Test the route to any server, website, or host.
Visual diagnostics for every device between you and your destination.
Plot performance over time and share the results in an easy-to-read format.
- Admin in Industrial Automation
Read full review


