

The Trace Graph
The Trace Graph shows the details of your current trace.
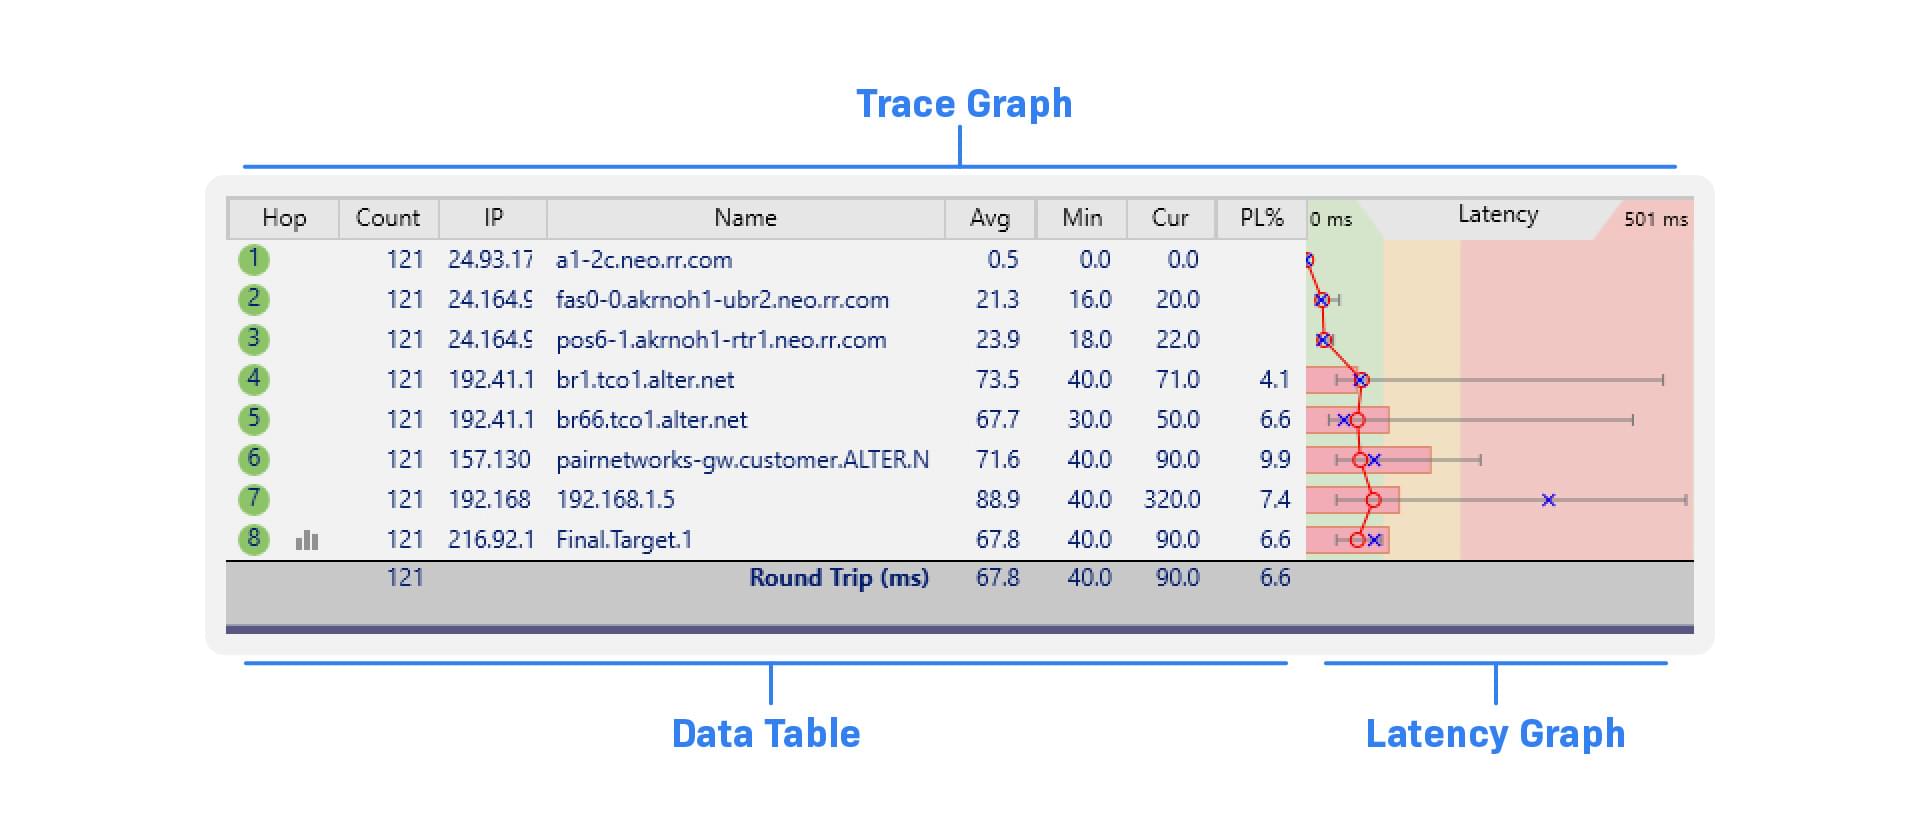
The Trace Graph is made up of two parts, the Data Table and the Latency Graph.
The table on the left is the Data Table, which shows the raw details of each hop between you and your target. The graph on the right is the Latency Graph, which gives you a visual representation of the trace data for easy parsing.
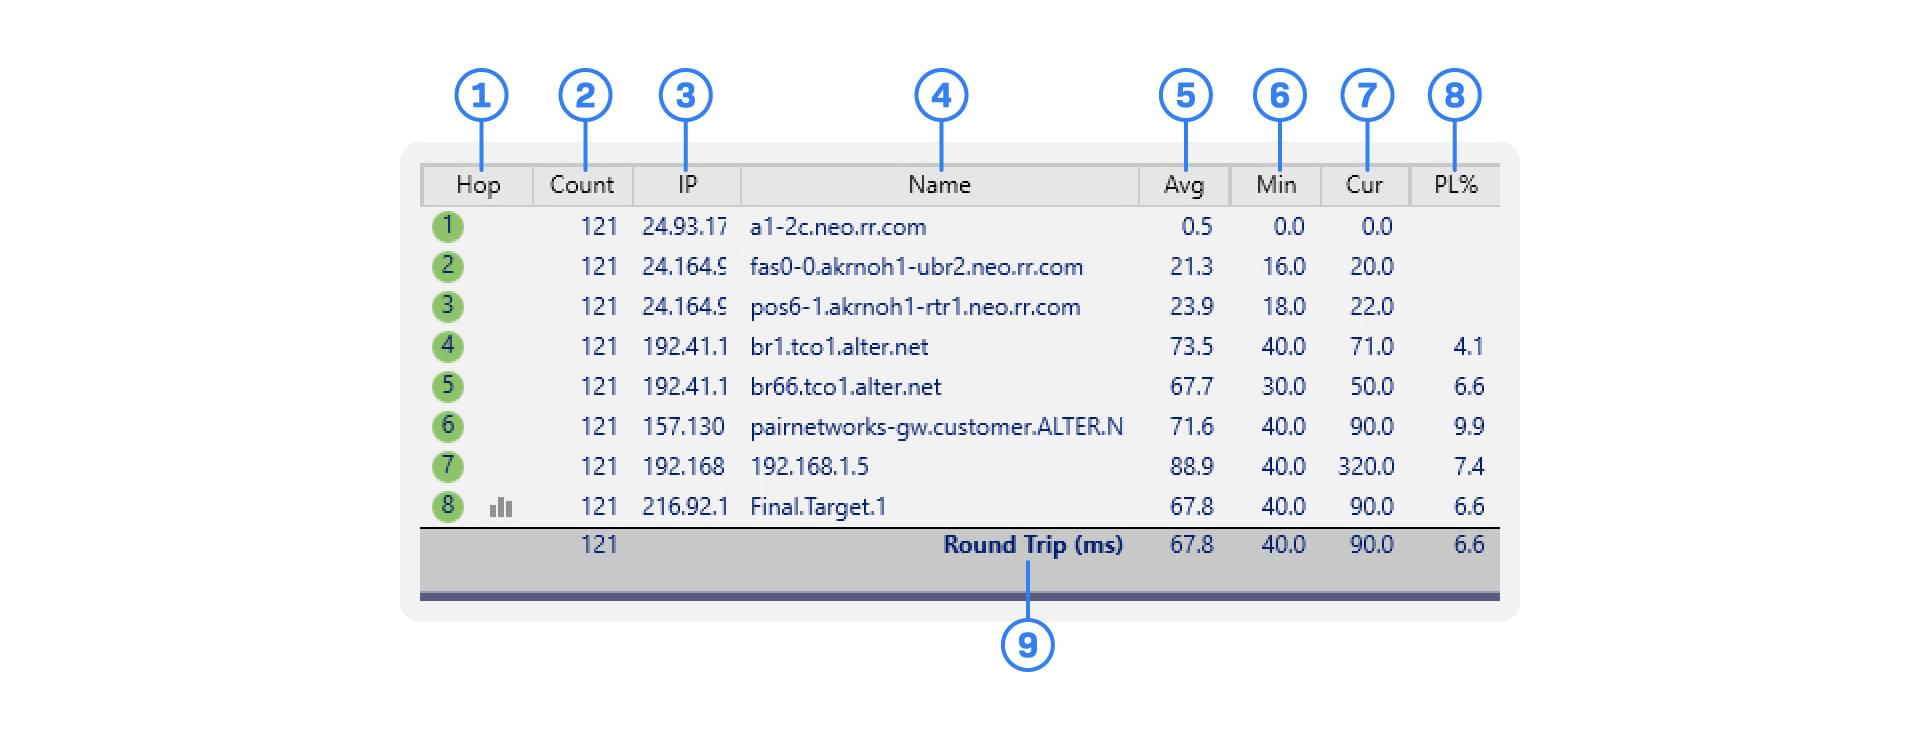
Data Table
-
Hop Number
This lists the order of hops between you and your target. A circle denotes an active hop and is color-coded to show latency based on the Graph Color Legend. A graph icon shows which hops have a Timeline Graph open (more on that later). -
Count
The number of packets sent during the current focus period. -
IP Address
The IP address of the device at the hop. -
DNS Name
The name of the device at the hop. If this is blank, it means the router/server/hamster wheel doesn’t have a DNS name or doesn’t like the packet type currently being used. -
Avg
The average ping response time for the current focus period. This average ignores timeouts and lost packets. -
Min
The fastest ping response time for your current focus period. -
Cur
The response time for the last packet sent. If you see “ERR,” the last packet sent was lost (poor little buddy). -
Packet Loss %
The percent of lost packets over the current focus period. -
Round Trip
A simplified set of data for the target of your trace. This shows the total time it takes to send a packet from your device to the target and back.
Latency Graph
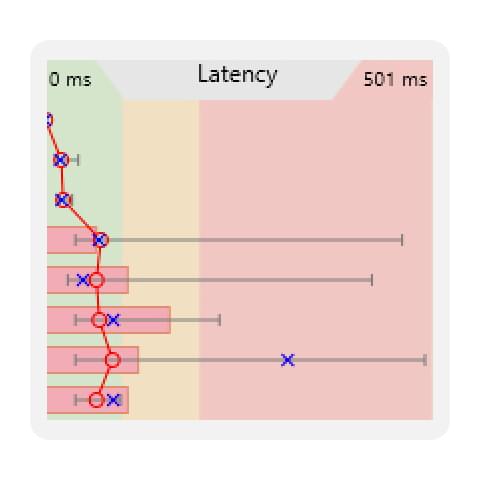

Average latency for the current focus period. This average ignores timeouts and lost packets.

The response time for the last packet sent.

The range of latencies recorded for a specific hop during the current focus period.

A cool connect-the-dots to help you visually track hop latency.

A color-coded representation of latency, as defined by the Graph Color Legend in the Target Bar.

The percent of lost packets over the current focus period.
Reading the Trace Graph
The Trace Graph gives you a bird’s-eye view of your collected PingPlotter data. As the data collects, you can begin looking at the Data Table and Latency Graph to find patterns of high latency and packet loss.
On the Latency Graph, the average latency of each hop is shown as a red circle. The range of latency values for each hop in your current focus period is shown as a horizontal gray bar. If the high end of your latency range is dipping into the red, you should give the offending hops a closer look.
The percentage of lost packets over the current focus period is indicated by a horizontal red bar. When you see a red bar, it means, at some point during testing, PingPlotter was unable to reach that hop. If PingPlotter’s packets couldn’t make it, there’s a good chance your other ones couldn’t, either. It’s often a good idea to inspect hops with packet loss.