Getting Started Guide
Timeline Graphs
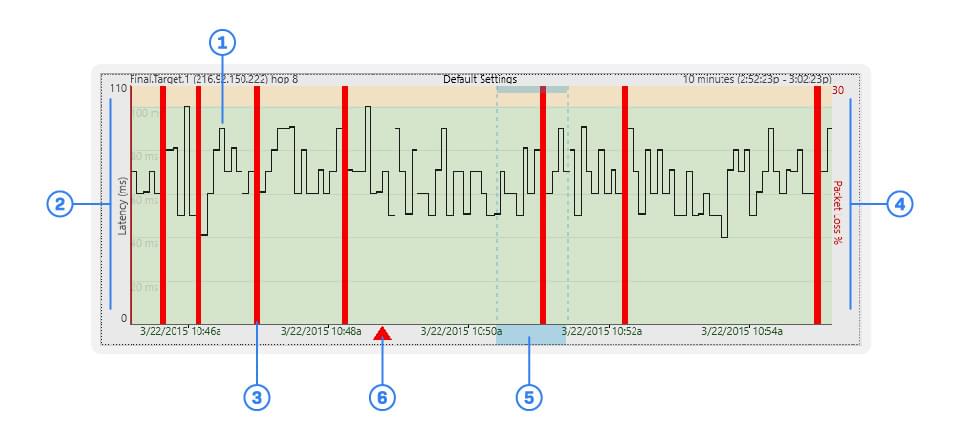
The Timeline Graph is a visual representation of your collected trace data. It helps you see the fluctuations in network performance over time.

-
Latency
The ping round-trip time to the selected hop. -
Latency Scale
A reference to aid in evaluating hop latency. -
Lost Packet
An indicator showing a packet sent in that trace interval went MIA. -
Packet Loss Scale
The percentage of packets lost within the displayed timeline segment. -
Focus Area
The section of collected data currently being displayed in the Trace Graph. -
Comment Indicator
An indicator showing a comment made at a specific point in time on the Timeline Graph.
Reading the Timeline Graph
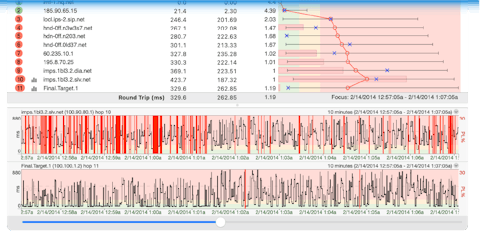
By default, the Timeline Graph shows the performance of your final hop (the trace target) over the last 10 minutes. You can open additional Timeline Graphs for a hop by double-clicking on the corresponding hop in the Trace Graph. You can change the time frame graphed by right-clicking on the Timeline Graph. You can also scroll the Timeline Graph with the mouse scroll wheel or by clicking and dragging on the graph.
Graph.
Latency is represented by the black line snaking through the graph. If the black line is spiking into the red, you’re experiencing high latency. Packet loss is displayed by a vertical red line on the graph. If you see a grouping of red lines, it’s worth inspecting.
Focus
By double-clicking on an area on the Timeline Graph, you can center the focus period on any data you wish to inspect in detail. You can adjust the focus window by changing the focus time in the Target Bar. If you want to reset the focus period to show current timeline data, right-click the Timeline Graph and select “Reset focus to current.”
Comments
Sometimes it helps to make a note for your (or someone else’s) reference on an event in the Timeline Graph. By right-clicking and selecting “Create Comment,” you can add a comment to a specific point in the timeline. This comment is saved with your other PingPlotter data, so anyone you send your sample set to can bask in your infinite wisdom.
To read a comment, simply hover over the indicator. Right-clicking on an indicator allows you to edit or delete any added comment. Nifty!

