

Capturing Evidence of the Problem
Nice work! You started a PingPlotter test. Keep the program running while you go about your regular business. If you're having problems with an online game, play the game. If the problem is related to website, go there. You get the idea. Next time you notice your problem happening open up PingPlotter and take a look.
Focus on the upper half of the program. We call this section the trace graph. Do you see any red bars? If you do, you might have something interesting. Here are some examples of how problems look in PingPlotter.
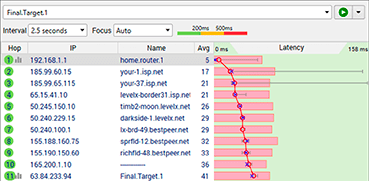

The basic rule with PingPlotter is "Red is Bad". There is, of course, some nuance to that statement (see below), but for our purposes, you'll be on the right track if you follow the red bars. More problem examples are available in our common network problems article if you are interested in learning more.
Watch out!
Not all red is bad
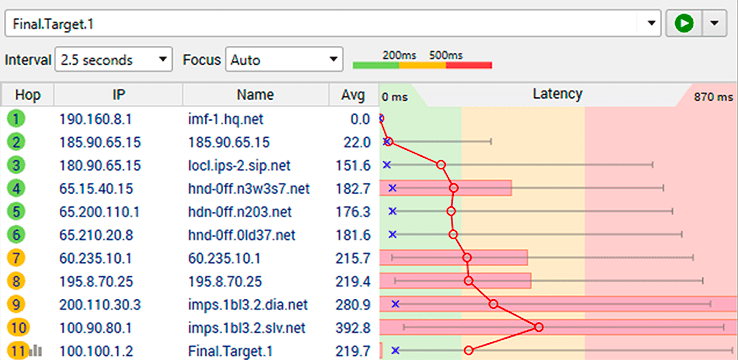
OK, so going back to the nuance we mentioned, not all red suggests you've captured a problem. If you see one red bar, and it's not the row at the bottom, that's nothing to worry about.
We'll spare you the details here, but if you're interested in why check out this article to learn what's happening.
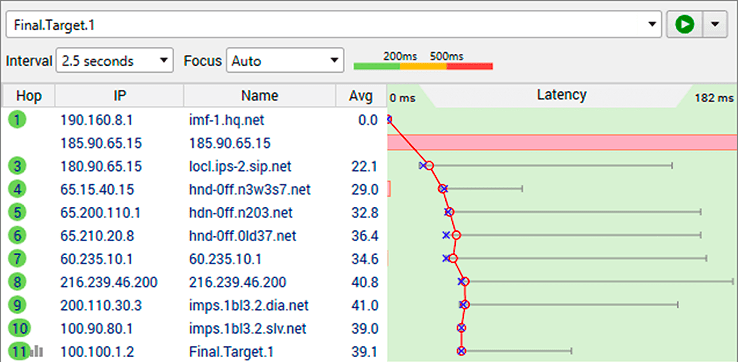
Ignore red bars if the pattern ends before the bottom row
Continue when you think you've captured a problem. Next, we'll start thinking about what the graph tells you about your network problem.
Let PingPlotter help you troubleshoot.
PingPlotter Sidekick automates setup and guides you through troubleshooting.