

PingPlotter Cloud Manual
Display
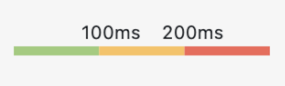
These boxes control 3 color-coded thresholds for latency. By default, all responses which fall under 100 ms and below will paint Green, 101 to 200 will paint Yellow, and over 200 will paint Red.
These thresholds apply to both of the symbol colors for the Hop and Status column and the Timeline and Trace Graph backgrounds. In addition, the legend in the upper-right corner of the interface will be updated with these numbers.
You'll likely need to change the numbers according to your internet connection speed. If you've got a T1 or a cable modem, the listed numbers are probably pretty good (you might move them down a little if you have a high-speed internet connection). If you have a modem or use DSL, you probably want to crank these numbers up a bit.
Changing these values will set the Green / Yellow / Red color threshold for the Latency Graph and Timeline Graph as well as the Hop and Status columns. This is dependent on your expected performance.
For more information about what to expect of your internet connection quality, check out this article.