

PingPlotter Cloud Manual
Using Summaries
A summary in PingPlotter Cloud is a place where you can group Target Sessions together. It gives you a way to compare data from multiple targets and also provides an easy one-glance summary of the important parts of your network.
By default, you'll have an All Targets summary which groups together all of the Target Sessions you have that are either Paused or Active.
The All Targets Summary
The All Targets summary contains all of the active Target Sessions. This summary is automatically maintained by PingPlotter Cloud; when you activate a Target, it shows up and when you close one, it's removed. You can rename this summary (or any other summary) by clicking the blue pen icon ![]() after the title.
after the title.
Adding a target to the summary screen
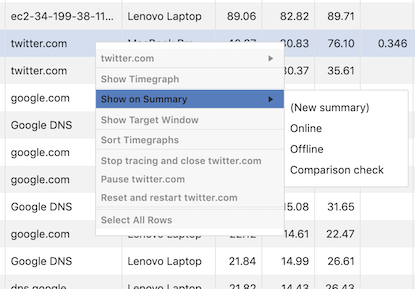
If you want to manually add a target (or any intermediate hop) to a custom summary graph (which we cover below), right-click on the Target row and select Show on summary -> (then pick a summary or create a new one). If you choose to create a New Summary, you will see it appear in the sidebar under Summaries.
From a summary screen, you can switch to the timeline graph view of a target by clicking on its blue IP address in the IPcolumn. You can also sort a list of targets by clicking on a column heading. Clicking again reverses the sort order.
Creating custom summary screens
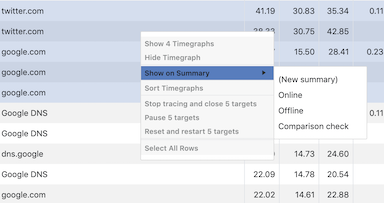
You can create multiple custom summaries to make it easier to group certain targets together. To create a new summary screen, right-click on a target, hover over Show on Summary, select (New Summary). Or, you can select multiple targets by holding down either the CTRL key (Windows) or the Command key (macOS). Give the new summary a name and then your browser will redirect you to that summary.
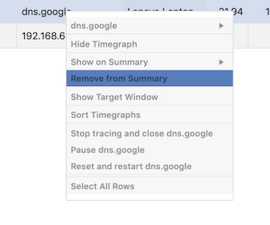
You can also remove targets from a summary screen with a right-click and select Remove from summary.
Multi-selected targets also have similar options available with the right-click menu (see above image). On all the listed targets, you can Stop & Close, Start, Pause, and even open multiple Timeline Graphs at once.
If you want to auto-maintain a summary screen based on network performance, you can use an alert to add or remove targets from a summary.