

PingPlotter Cloud Manual
Quality Monitor
How to monitor your network
Quality Monitor is located in the left-sidebar menu. Click on this to supercharge your network monitoring abilities.
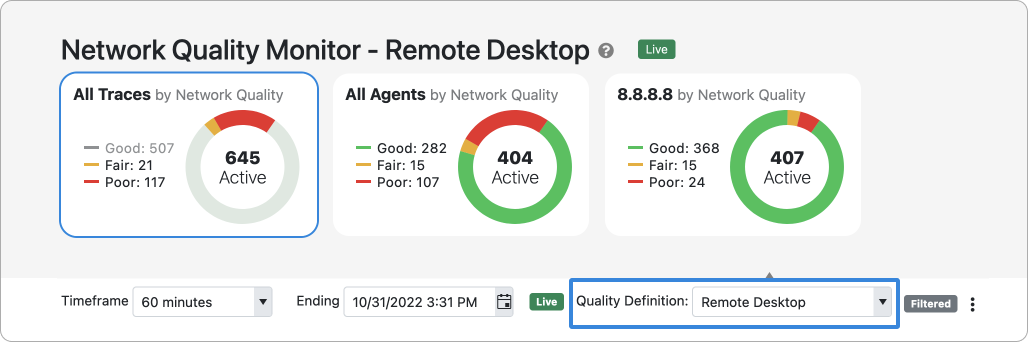
By default, this list will display traces from all agents that are currently online in the last 60 minutes. It’s sorted by the total amount of time in poor quality over the last hour. To zoom out and get a big picture of your network, select or type your desired timeframe, such as 1 week.
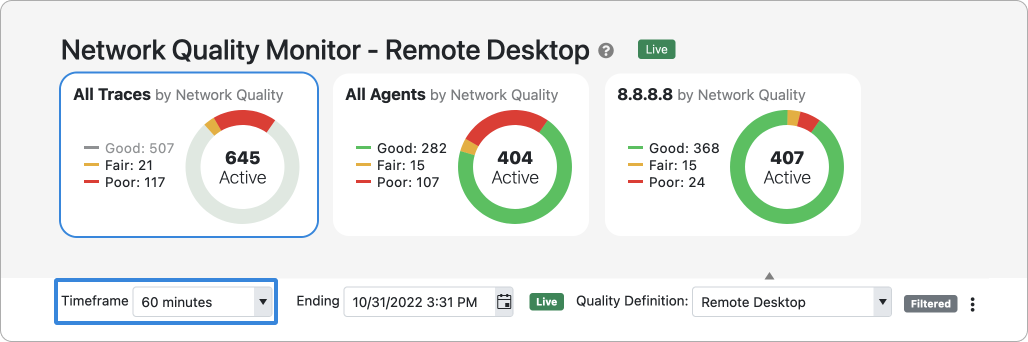
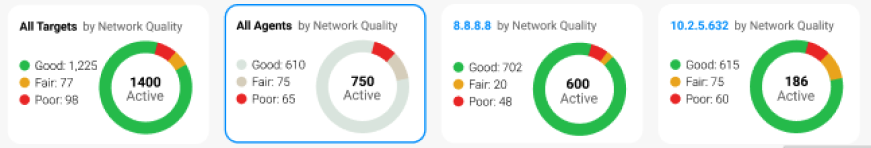
Donuts make it easy to filter which agents or targets you view. Click on poor on the donuts to only see poor targets/agents.
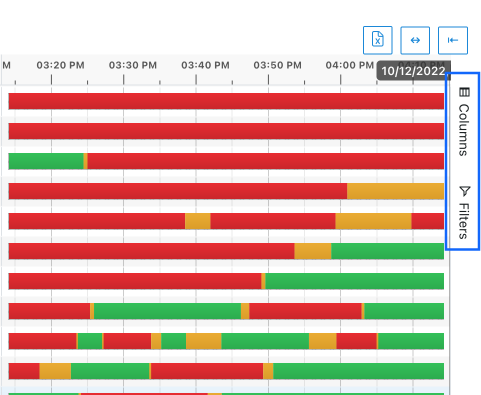
Quality Bar Legend
Good Quality
Fair Quality
Poor Quality
Offline
No Data
Green means that the network was good quality: the agent was connecting and reached the target within the 100 ms (or whatever you’ve set your latency threshold to if you’ve customized your quality definition).
Yellow means that that the network was fair quality: the agent was connecting and reached the target between 100 ms and 135 ms (or whatever you’ve set your latency threshold to if you’ve customized your quality definition).
Red means that the network was poor quality: the agent was connected but wasn't able to reach the target or that the latency was above 135ms. There was a disruption to the network and the agent experienced downtime.
Grey means that PingPlotter was not collecting data. This is usually because the device was offline.
Criss-cross grey lines - If PingPlotter is not able to communicate with the agent, it will show a criss-cross pattern. However, once the agent begins communicating with PingPlotter, it will backfill that whole criss-cross section with what happened. If the agent was offline, then it’ll backfill as grey. If the agent was connected but was not able to reach the target, then it’ll backfill that section as red. The criss-cross section will always appear at the beginning or end, it’ll never appear in the middle. If it appears at the beginning, that signifies that PingPlotter doesn’t have any data before that. If the criss-cross pattern appears after data was collected, it means that PingPlotter has not received any data after that (meaning that the agent hasn't been online since that period.)
There is also a difference between how Macs and PCs collect data.
Mac’s collect data intermittently when they are offline. This is why they are often grey (offline) but there are spikes that appear at consistent intervals (see image below).
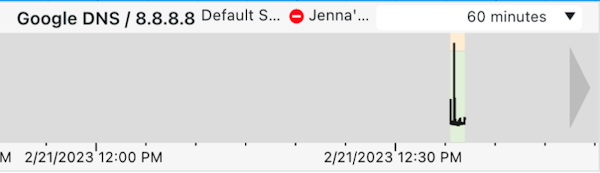
PCs do not collect data when they are offline. This is why they are consistently grey when they are turned off or they have the criss-cross pattern until they come back online.
How is good, fair, or poor quality determined?
It’s based on your quality definitions. You can customize your Quality Definition to be perfect for your organization. Pick the quality definition that best fits your company (such as VoIP for call centers).
Click on the quality bar or the chevron next to the agent name to open the Timeline Graph.
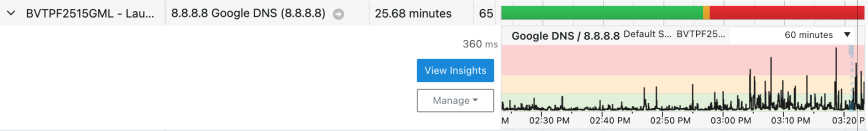
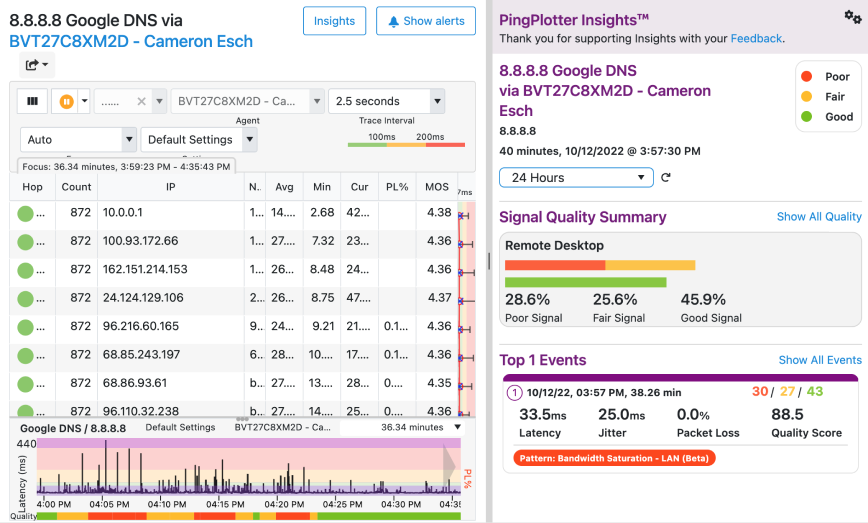
Click on View Insights to open the target page and see what might be causing the issue.
Pro Tips
Navigation
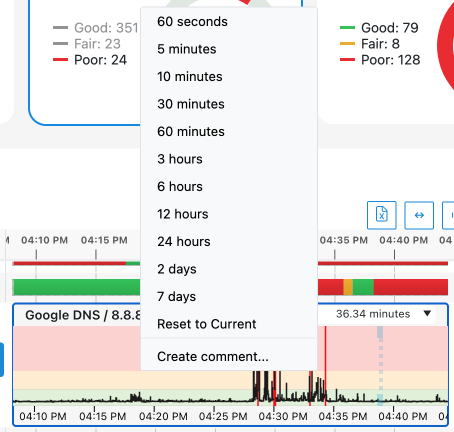
To view more than the visible timeframe, click on the Timeline Graph and scroll to the left or the right to adjust the time visible. All quality bars will adjust to the visible timeframe.
You can also right click on the graph to select a specific timeframe.
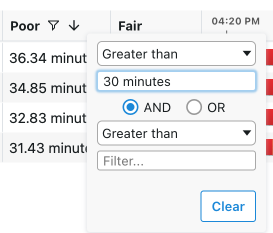
Additional Filters
To further customize the list, click on Columns or Filters to the right of the quality bars.
Or filter using the headers. For example, to filter by agents with poor quality over 30 minutes, click the hamburger menu next to poor. Then enter 30 minutes.
If you have any questions, please email support@pingman.com.