PingPlotter Cloud Manual
Quality Score Definitions
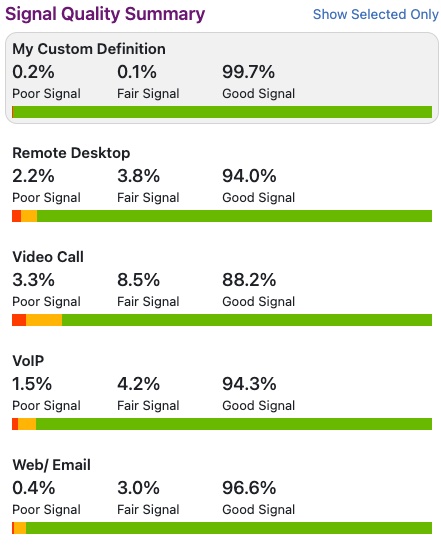
A Quality Score Definition determines the point at which a network connection is no longer suitable to perform a specific task, such as Voice-over-IP calling. It combines the Latency, Jitter, and Packet Loss of each sample to determine if the signal was Good, Fair, or Poor. Insights displays these results as a percentage of time in the Signal Quality Summary.
Understanding the Quality Score Definition
PingPlotter Cloud includes 4 default Quality Score Definitions:
- Remote Desktop
- Web/Email
- Voice-over-IP
- Video Call
As mentioned previously, each of these definitions combines the Latency, Jitter, and Packet Loss of each sample to determine the Overall Quality Score. Let's look at this in more detail.
The formula runs through the data using a window of time. It gathers all of the data points in that window and averages the Latency, Jitter, and Packet Loss of every sample found. It then determines a Quality Score for these 3 data points. An Overall Quality Score is then found by taking the 3 Quality Scores found earlier and subtracting them from 100.
For example, let's say after running the formula Insights finds a Quality Score of 6 for Latency, 12 for Jitter, and 2 for packet loss. My Overall Quality Score would be 100 - 6 - 12 - 2 = 80.
Editing a Quality Score Definition
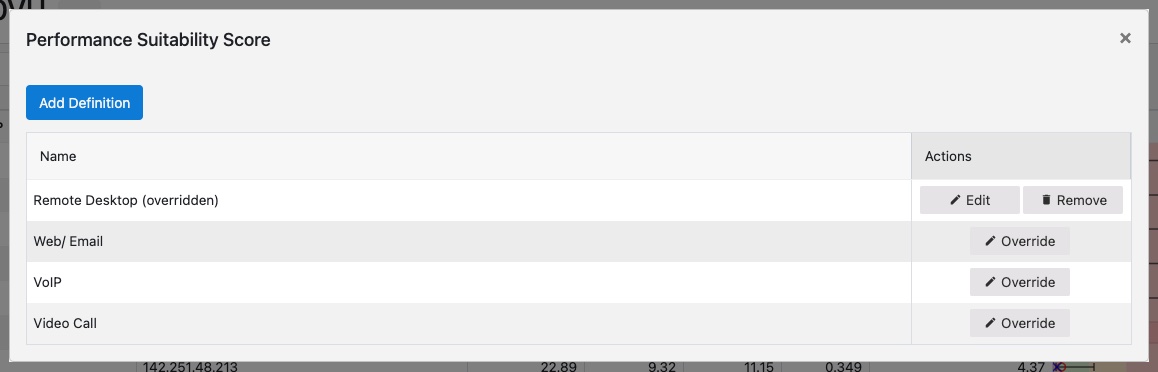
If the default definitions don't quite fit your needs, you can edit them by going into the Insights settings panel. Follow these steps to edit a Quality Score Definition:
- Click on Quality Monitor in the left-sidebar menu.
- Click on the three dots next to the Quality Definition dropdown.
- Select View all Quality Definitions.
- Click View next to the Quality Definition you want to adjust (or hit Add Definition to create a new one).
- Select Edit in the upper-right corner.
- Make the changes and select Update.
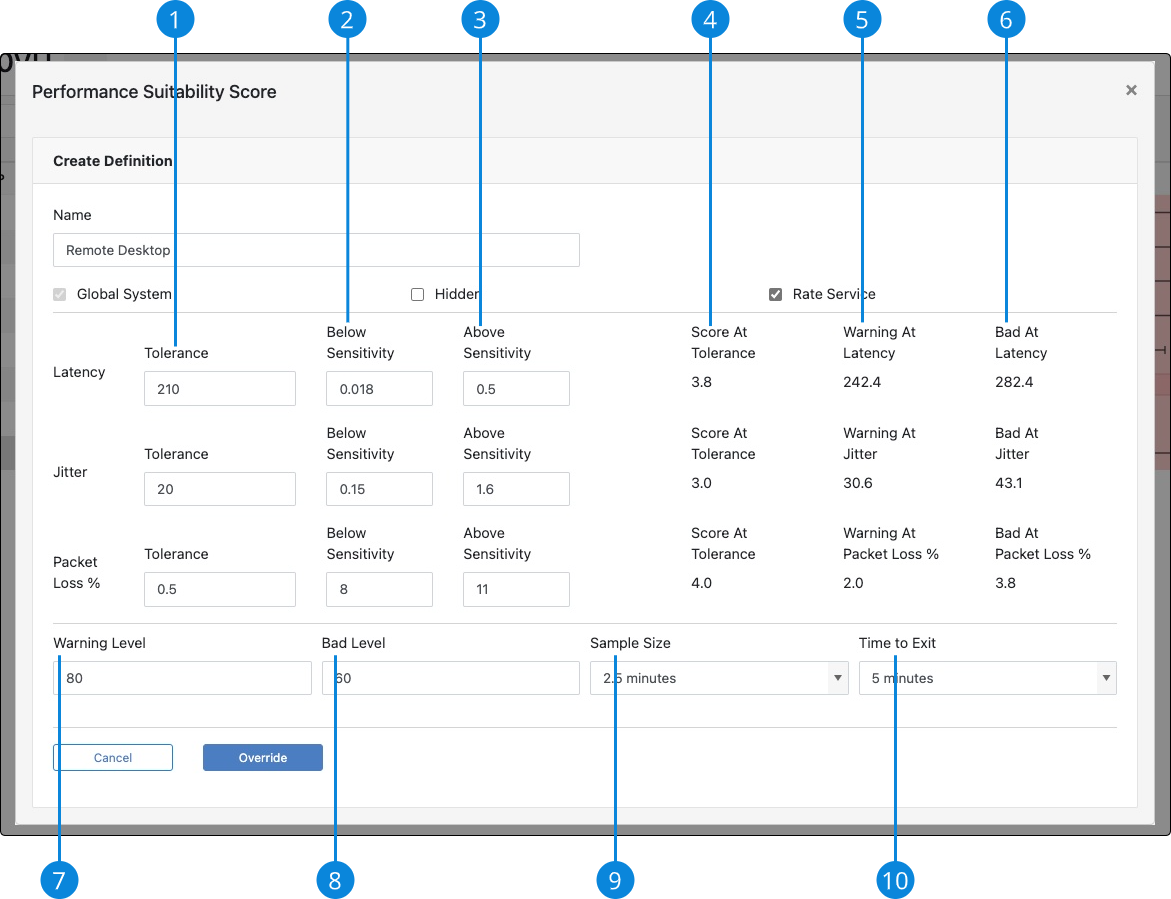
Here is a quick overview of each field:
-
Tolerance
The "sweet" spot for the given data point, i.e. Latency -
Below Sensitivity
Any sample with a value below the tolerance will be weighted with this value. Increasing this will increase your Score at Tolerance. -
Above Sensitivity
Any sample with a value above the tolerance will be weighted with this value. Increase this to get to the Warning Level and Bad Levels "faster". -
Score At Tolerance
If the value of the given data point were at the tolerance, and all other values were 0, this would be the Quality score for the given data point, i.e. Latency. -
Warning At
The value of the give data point required to hit the Warning Level if all other values were 0. -
Bad At
The value of the give data point required to hit the Bad Level if all other values were 0. -
Warning Level
The Quality Scores for Latency, Jitter, and Packet Loss are subtracted from 100 to give an Overall Quality Score. Any Overall Quality Score that falls between this value, and the Bad Level, will be considered Fair. -
Bad Level
The Quality Scores for Latency, Jitter, and Packet Loss are subtracted from 100 to give an Overall Quality Score. Any Overall Quality Score that falls below this value will be considered Poor. -
Sample Size
Increasing this value will require a larger network disturbance in order for the Overall Quality Score to decrease. -
Time to Exit
Increasing this value will require an Overall Quality Score to be stable for longer in order to "exit" a zone, i.e. Poor to Good.
The new parameters will go into effect the next time you run Insights. To set the parameters back to their default values, select Remove from the Actions column.
Creating a New Quality Score Definition
If you would like to measure the Quality Score for a service that is not included in the defaults, or maybe you just want to create your own, go to Edit Quality Definitions and then select Add Definition. Give it a name, set your parameters, check the Rate Service box, and then select Create.
Your new Quality Score definition will be available the next time you run Insights. See your definition by selecting Show All Quality from the Signal Quality Summary. Click on the new definition to set it as the default.