

Version 5 Manual
Interpreting Results - A Quick Example
So let's get into some specific examples of how to interpret the results from PingPlotter.
For the first example, you're getting intermittent packet loss to Final.Target.1. What can we determine from the graph below?
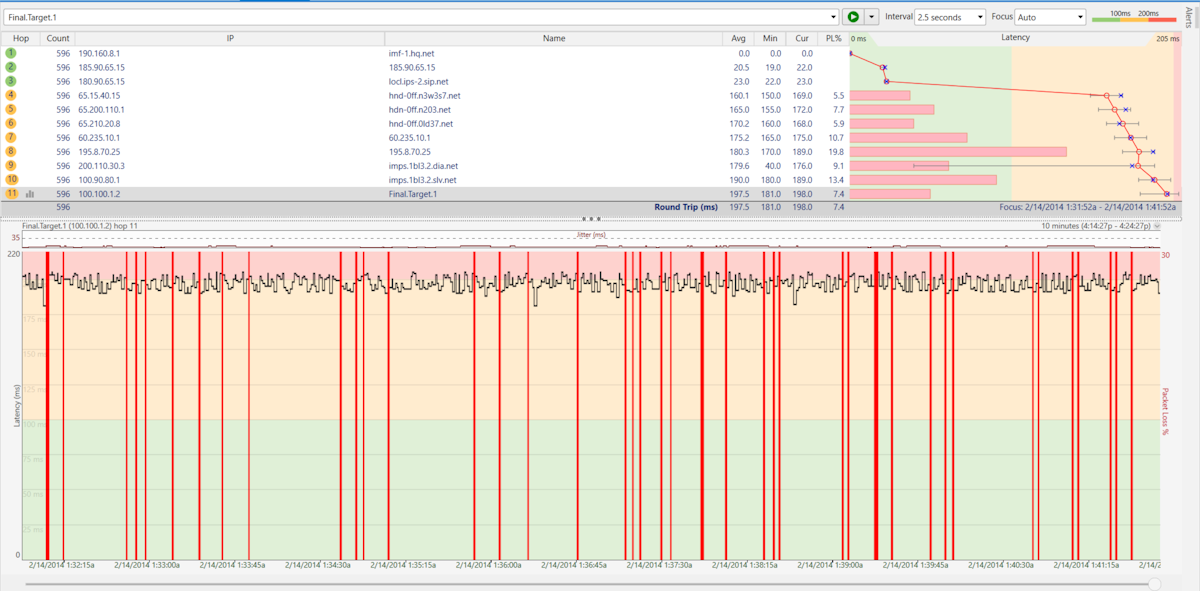
First off, the final destination (hop 11) shows 7.4% packet loss. There's a problem someplace in the route, but we need to determine where....
Hop 4 shows 5.5% packet loss, and this packet loss is carried on through to the final destination. This is a huge indication of where the problem lies.
Now, all we know from this is that the problem happens after hop 3. We don't know if it actually happens because of CPU overloading in hop 4, a router problem in hop 4 (or even on the exit side of hop 3), or if it's the connection between hop 3 and 4. A little bit more troubleshooting is needed for this.
Digging deeper, we can see (from the domain names) that hop 3 is in the sip.net domain, while hop 4 is in the n3w3s7.net domain. Also, the IP addresses show decidedly different ranges. This is a strong clue that it's actually the connection between hop 4 and 5 that's causing the problem. It's likely that there's not enough bandwidth between those two locations.