

Version 5 Manual
Navigating the web UI
Important! PingPlotter Professional's user management and LiveShare features have been modified. Learn more.
In most cases, the PingPlotter Web UI is functionally identical to the app. If you are familiar with the basics of PingPlotter’s interface, you should feel right at home in the web UI.
Note: While the majority of PingPlotter’s feature set is identical between its app and web UI, some features may only be available in one, but not the other.
Session and trace management
When first logging into PingPlotter’s web UI, you will be greeted with your All Targets summary.
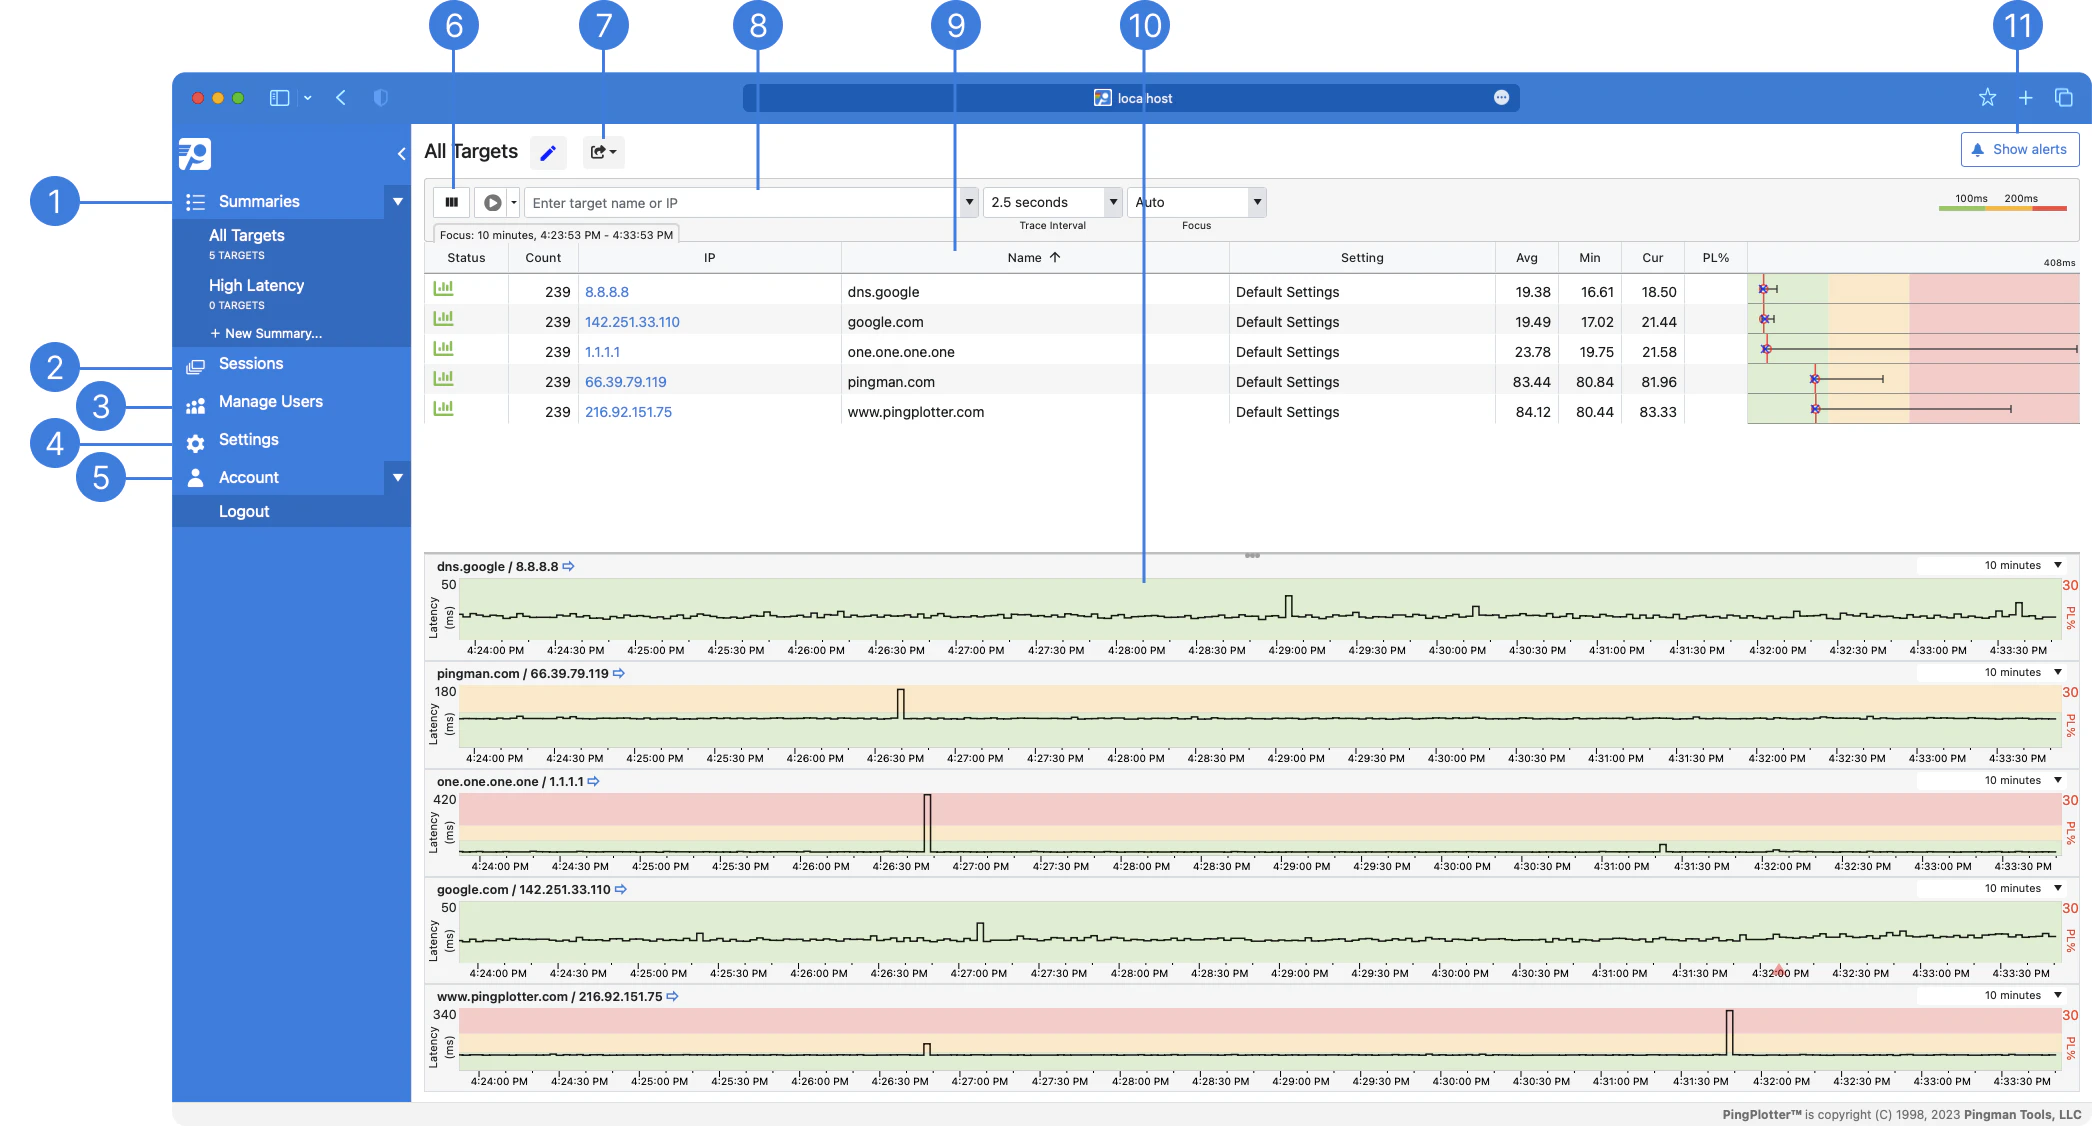
- Summaries: This is a list of all your current summaries. You can create a new summary by clicking New Summary at the bottom of the list
- Sessions: A convenient list of all current and previous traces
- Manage Users: Add new users and manage individual user permissions
- Settings: Adjust general settings and PingPlotter packet engine settings
- Account: Logout of the current signed-in user
- Change columns: Add or remove columns of data to customize your web UI
- Share: Create a LiveShare (read-only weblink) to the current summary, or take Snapshot image
- Target Bar: Start, pause, stop, and configure a PingPlotter trace to a specific IP address or DNS name
- Target summaries: A list of every trace target in the current summary
- Timeline Graphraphs: A graph of network performance over time. Double-click the green, yellow, red or black Status Light on the left side of any target row to add a Timegraph to the bottom of the screen
- Show/Hide Alerts: Show or hide the alerts sidebar, where you can add or edit alert actions
Left-click on a target’s IP to move to a detailed view of the trace.
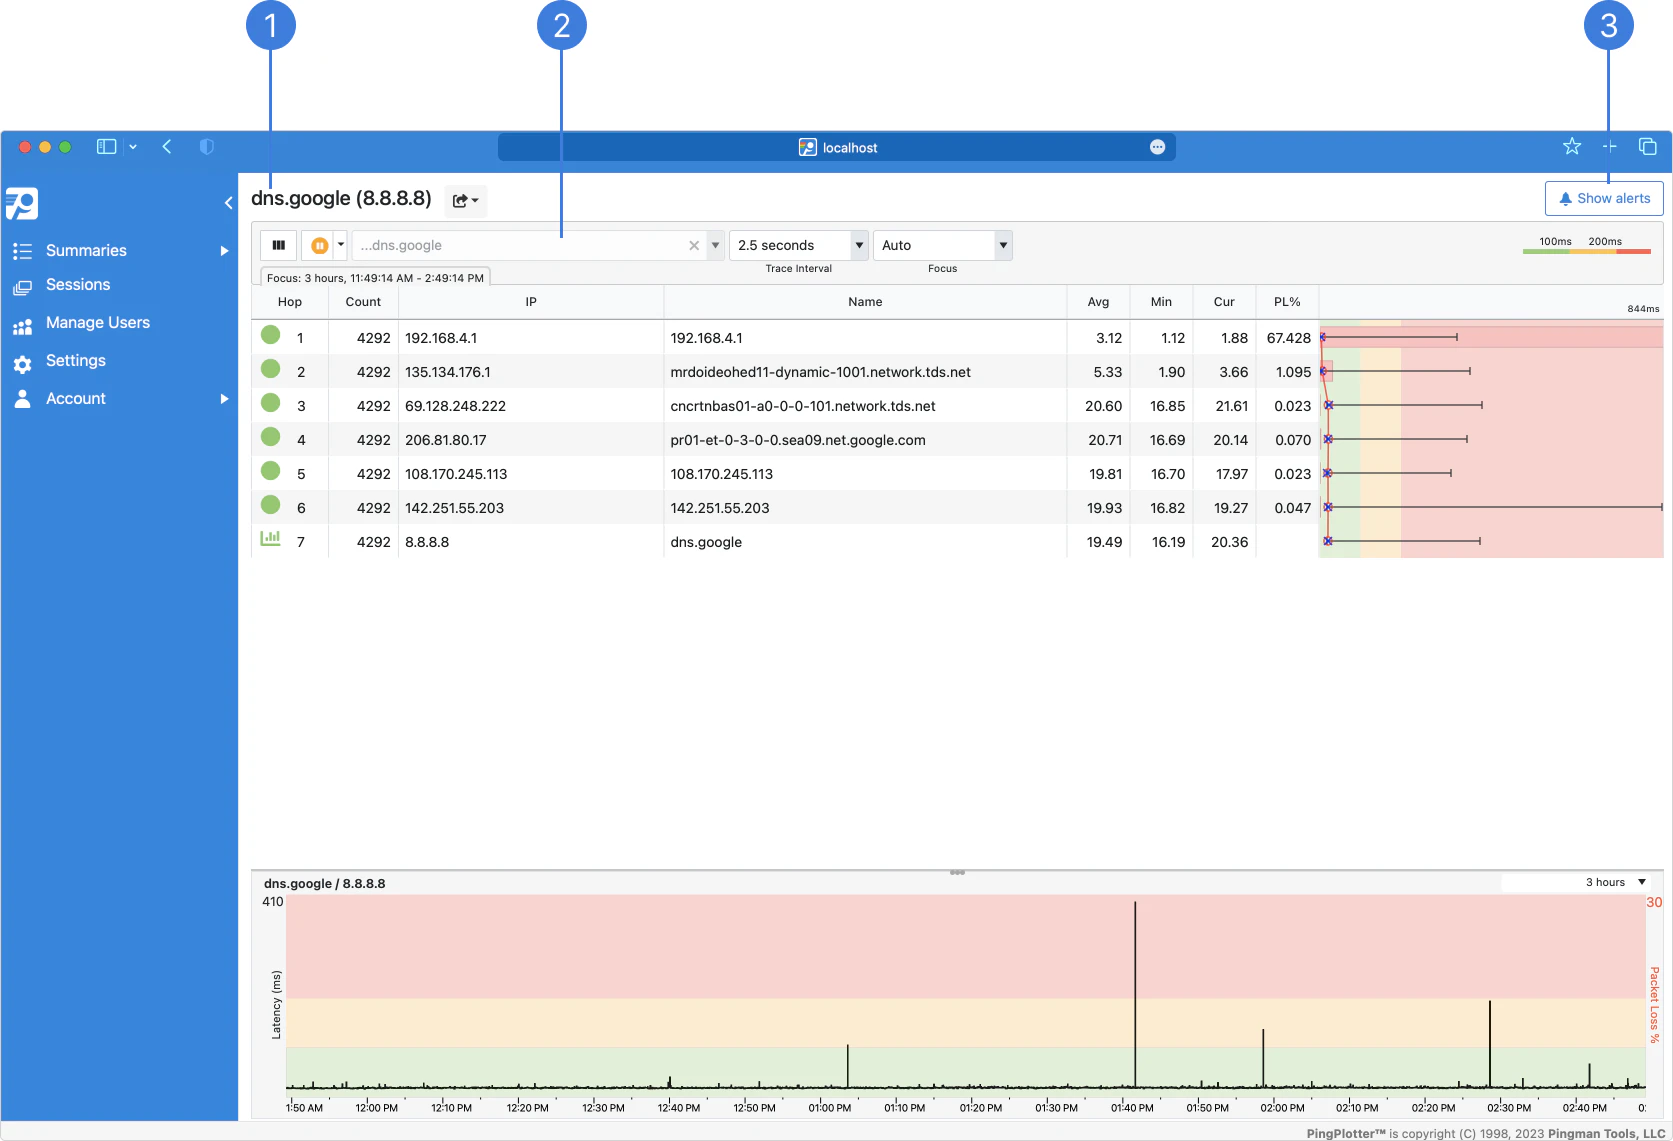
- Target and device name denotes the trace target and the device running the trace
- Trace Graph: A list of every hop between the device conducting a trace and the targeted endpoint
- Show/Hide Alerts: Show or hide the alerts sidebar, where you can add or edit alert actions
Configuring alerts
PingPlotter’s alert functionality is a powerful tool for managing and monitoring network performance.
Selecting Show alerts will open the Alerts tab on the right side of your browser window.
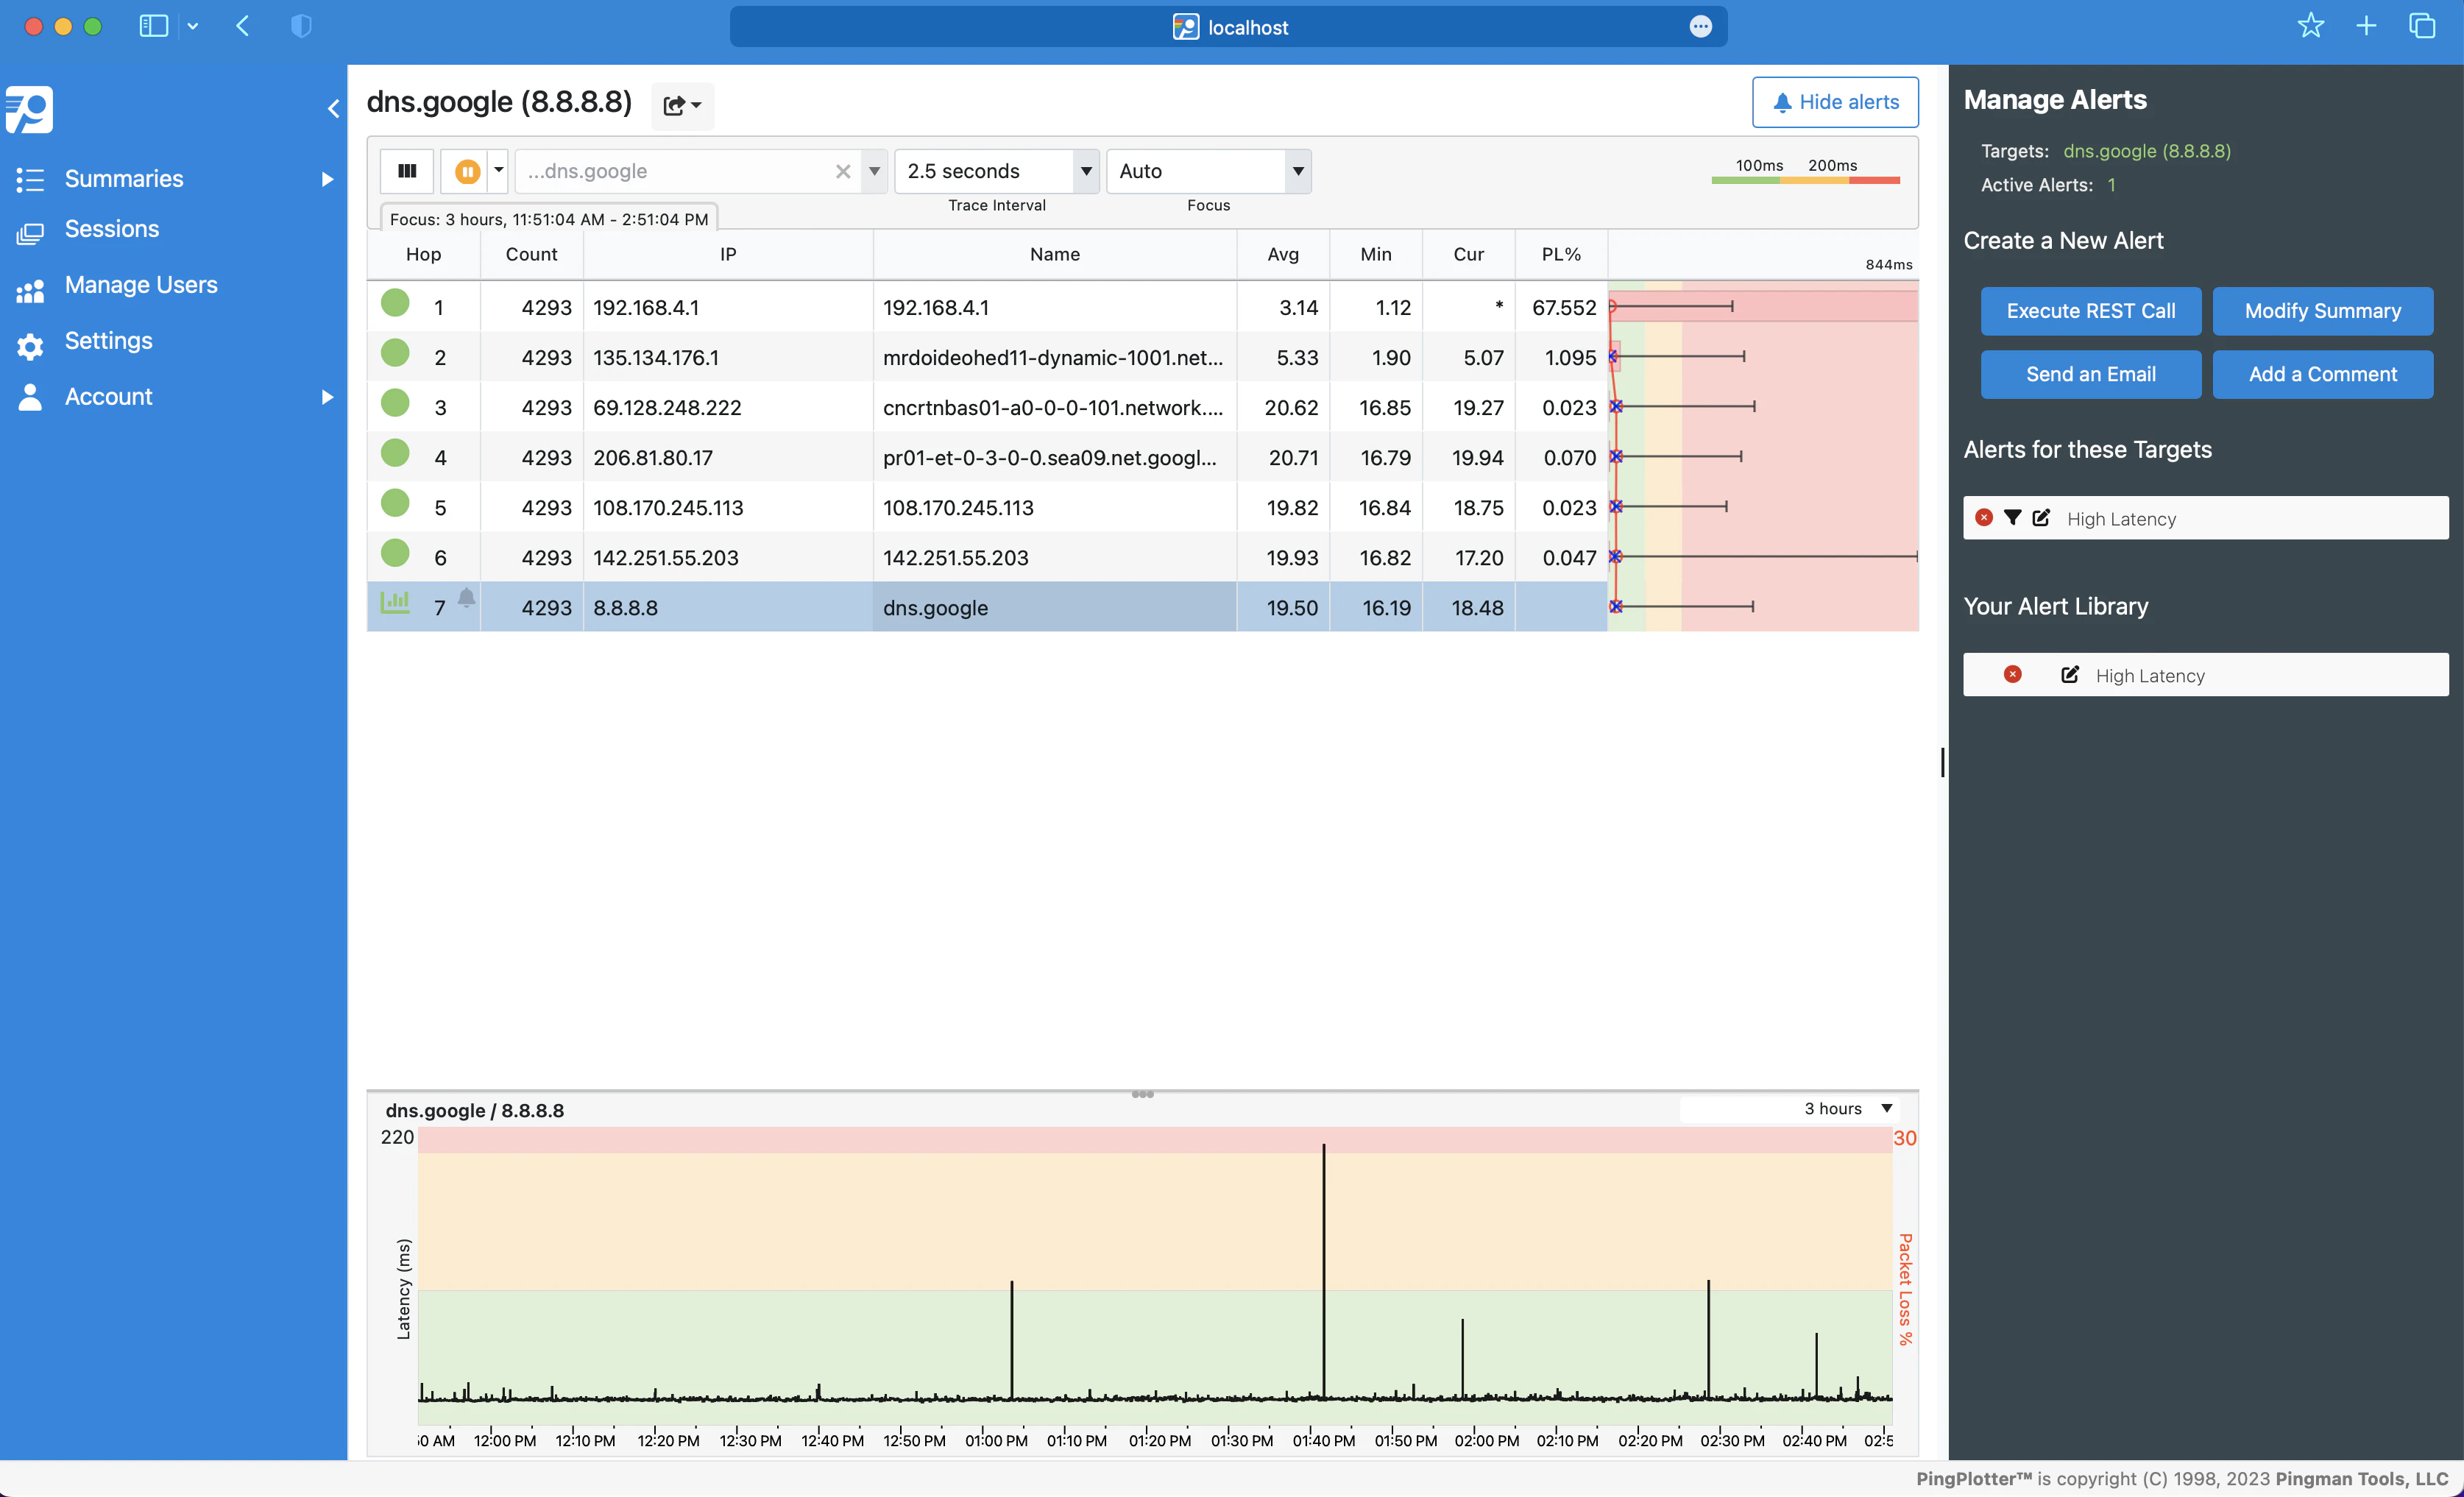
Here, you will be able to create, apply, manage alerts for your trace targets. To learn more about PingPlotter’s alert feature, please see the relevant section in the PingPlotter manual.
Configuring settings
A number of important PingPlotter settings can be modified from within the web UI. This includes general PingPlotter settings and packet engine configurations.
These settings are identical to those used within the application. Please refer to the relevant manual pages to learn more about PingPlotter's packet options.
Some of the features listed in this topic are only available in PingPlotter Pro and/or PingPlotter Standard. See our product comparison page for details.