

Version 5 Manual
Interpreting ISP Problems | PingPlotter
For this example, we're assuming the role of a user that's having problems with a broadband connection. What we'll be taking a look at is a few days worth of trace data.
Before continuing, if you're not familiar with how the graphs work in PingPlotter please make sure you've read the introduction to graphs earlier in this tutorial.
What should I target?
If you're not sure what to target, 8.8.8.8 Google DNS is usually a good place to start. It's widely available and accessible in most cases.
One common mistake we see folks make is that they'll trace to their ISP's border router. This is a bad thing. If you're tracing to the border router and your route changes (i.e. they take that router down for maintenance or you get load balanced onto another router) you really have no idea what happened.
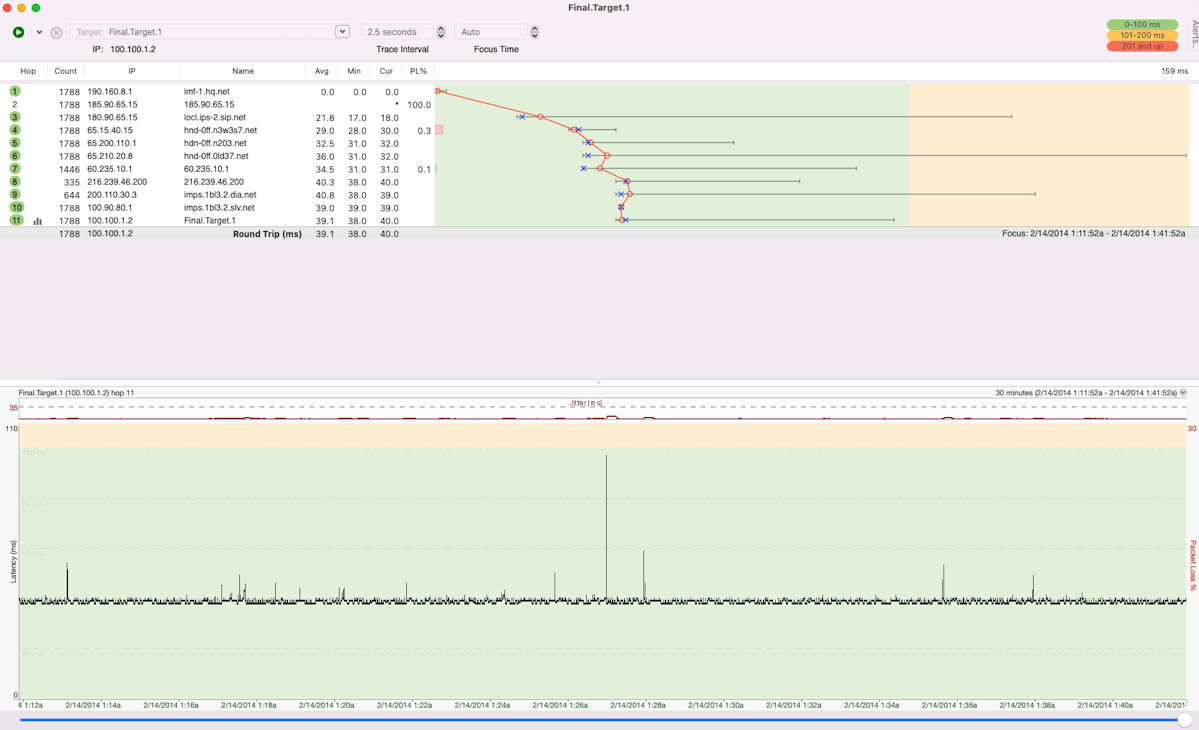
This first graph shows what the traceroute should look like with no load on the connection, i.e. no downloads, streaming audio, on-line game playing, etc. Things are looking good!
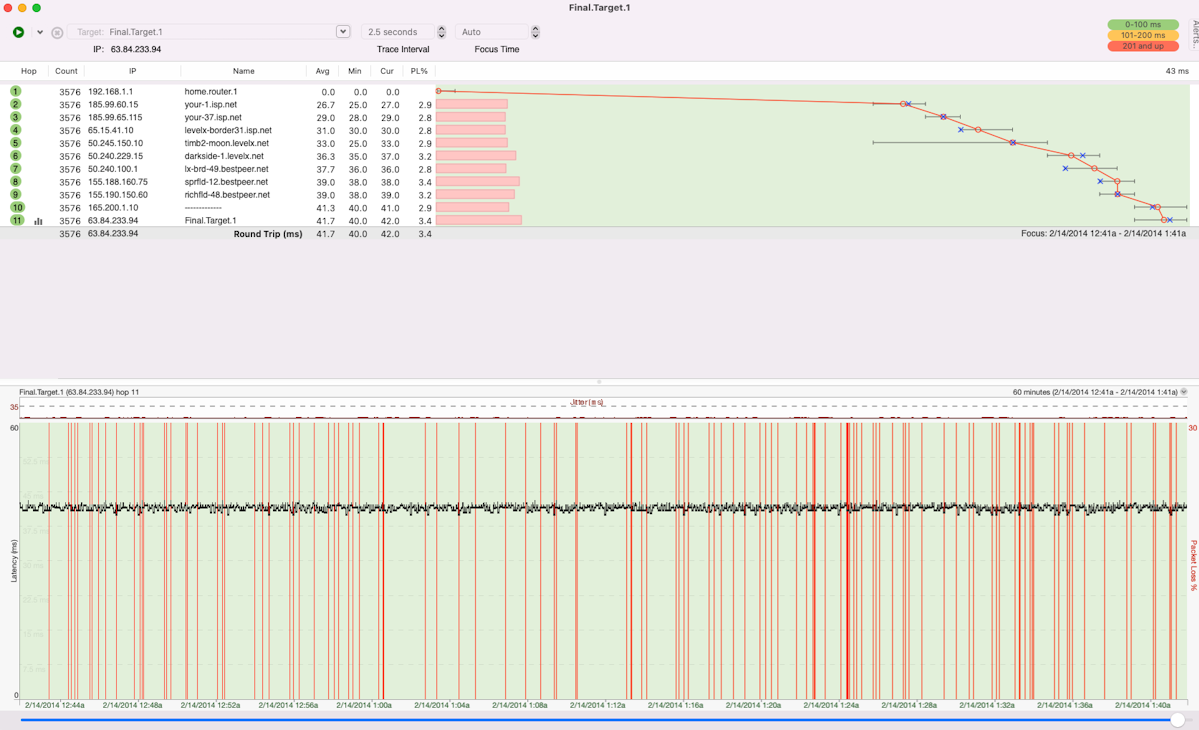
This second graph starts painting a different story. Remember: red is bad! We can see here that we regulularly get packet loss tyring to reach out final destination. Sending our ISP this graph will probably get a tech to come out and run some tests. However, we can get even more specific with the specific hop that is giving us grief. Take a look at the next graph.
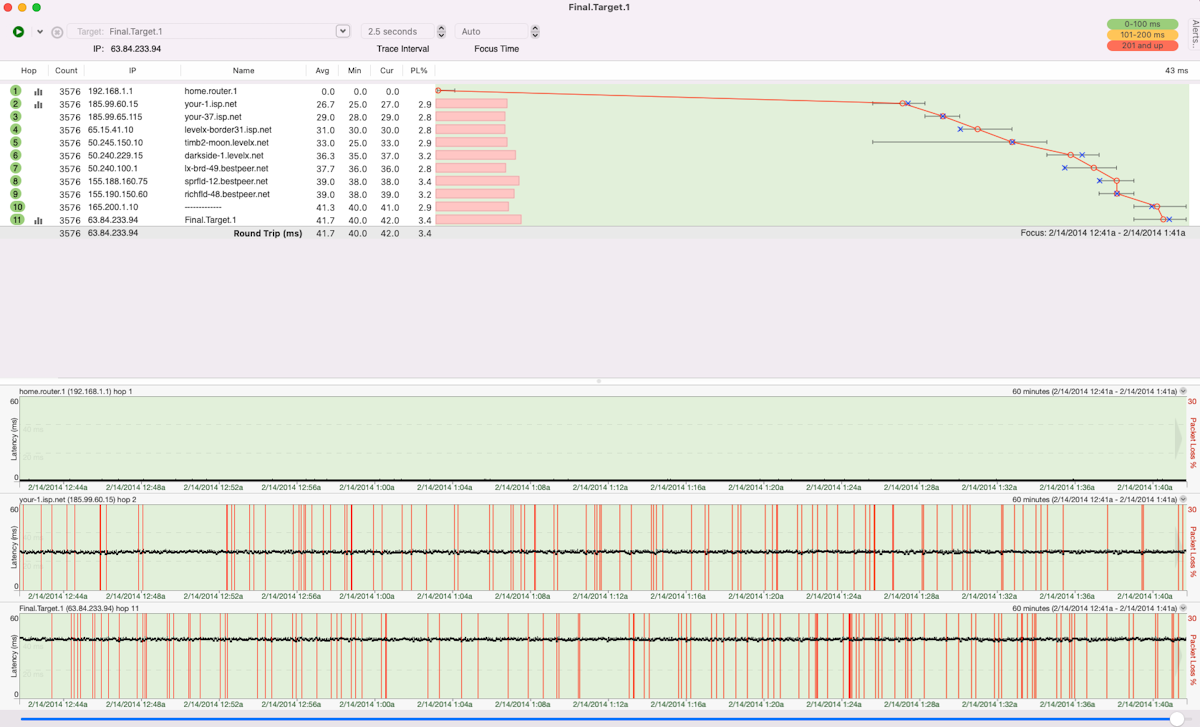
If you open the timeline graphs for each hop (double-click on the hop number), working your way back through the route, you'll find that the pattern of latency and packet loss starts at hop 2 as shown in the graph above. We leave hop 1, 2, and the final destination open to show where the route is good, and where it starts to go bad, and that the final destination is affected by what's happening earlier in the route. This is a really good indicator that the issues you're having start in your ISP's network.
This same method can be applied to about any situation. When you start to see red packet loss or high spikes in latency, work your back through the route until you identify where that pattern beings. Wherever that is first introduced in the route is usually a good indiator of where your issue is whether that's in your local network, your ISP's network, or somewhere further upstream.