

Version 5 Manual
Interpreting Results - Bandwidth Saturation
Every network connection has a limit, and in this example we'll talk about how to recognize bandwidth limits on a local DSL / Cable modem.
The scenario here is a 30Mbps downstream, 10Mbps upstream cable modem running a 2.5 second trace interval to our target. The computer running PingPlotter was connected to the cable modem via a wireless network card, which loses packets occasionally.
We're downloading a 2 gig file, and during this period the bandwidth of the cable modem should be completely saturated. This means that anyone else using this network connection is going to notice significant latency and possible packet loss. Any user might decide they want to troubleshoot this situation, and might run PingPlotter to do so.
A quick 10 minute trace might look something like this:
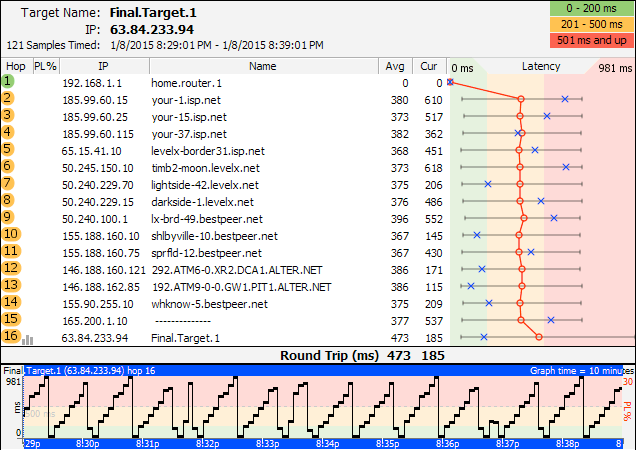
First, notice the big latency jump between hop 1 and hop 2 - the DSL modem. This same latency jump is translated into all downstream hops, which indicates that hop 2 (or the link between hop 1 and hop 2) is significantly impacting network latency. Since we know what's going on here, it's pretty easy to recognize. In a lot of cases though, you might not know what's happening and you'll see latency like this.
Now, the "Sawtooth" pattern in the timeline graph is a classic bandwidth saturation pattern. Anytime you see a pattern like this, think "bandwidth saturation". Keep in mind that bandwidth saturation is totally normal, and happens on just about every network. Consumer-grade DSL and cable modems have the highest chance of seeing a pattern like this, but it can happen on any connection where the bandwidth at a network point is being totally saturated.
Here is another example of bandwidth saturation (with more time shown on the graph):
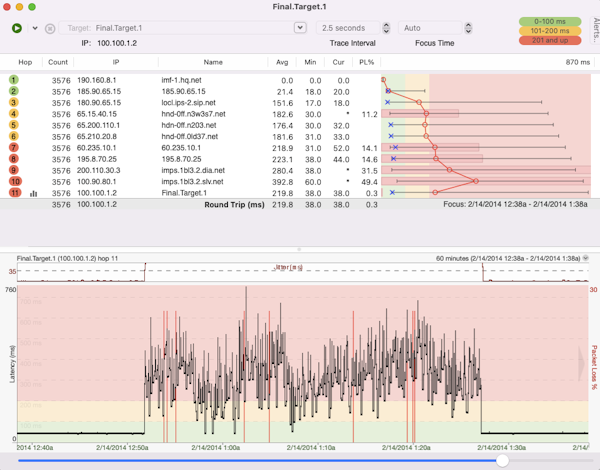
Here you see an 40 minute period where a large download was happening. Outside the download, the latency is pretty much rock solid. The packet loss stays relatively constant across the entire period, indicating that the packet loss isn't being caused by bandwidth saturation. We know that it's actually caused by a wireless network that has about 1% normal packet loss, and the download rate doesn't affect it at all.
There are several solutions to the latency problem:
- Procure (buy) more bandwidth
- Don't transfer as much data
- Implement QoS
This same situation happens in any network. Your ISP runs into these same exact options with the connection between their network and the outside Internet. They can limit what you download, or they can buy more bandwidth. On a bigger pipe the jump in latency isn't going to be as pronounced, and the bandwidth will be saturated by a number of different loads. Often on a primarily consumer-use network (DSL / Cable), the increase in latency will be gradual as more people use the bandwidth, and then it will gradually drop off as people stop using it. The rise in latency often happening at 6-9pm, and the drop off happening at 11pm - 1am. It's often accompanied by packet loss as well.
On your own network, the bandwidth saturation could be happening for a number of reasons: another user downloading something; temporarily restricted pipe size (problem with your Internet connection), p2p applications in use, or possibly even a virus/worm type application that is using bandwidth sending out new instances of itself.
In summary: Saturated bandwidth can be normal, and isn't always an easy problem to solve. It's often easy to recognize the symptoms though, especially if you look at the trend over time. PingPlotter can really help pinpoint the problem, giving you the ability to see trending over time, latency patterns short and long-term, and latency / packet loss correlations.