

A Broadcast Storm Defined & How to Fix It

A broadcast storm can send a network to its knees, and all it takes is one little slip-up.
“Everything’s down.”
It’s the absolute worst thing you can hear. One second, you’re chilling in that sweet new chair you just expensed, and the next, all the blood is draining from your face. As the possibilities scream through your head, you start to think it might be one of the worst: a broadcast storm.
With one simple mistake, a network can suffer a broadcast storm that locks up traffic completely for everyone connected. And when we say completely, we mean it — an entire office with zero connection. However, with a bit of sleuthing and the right tools, you can find your way to the eye of the storm and clear things up for good.
So, other than sounding cool, what’s a broadcast storm? The storm is actually an extreme version of something called broadcast radiation. Broadcast radiation and storming occur when a broadcast frame (DHCP or ARP request) or a multicast frame (OSPF or EIGRP message) enters a switch, is propagated out to all ports, then loops back to all the ports on the devices it just went to. The frame then ends up stuck in a cycle where it goes back to the original device and just keeps regenerating itself until the wire is so bogged down you can’t even Slack a meme.
Think of a broadcast storm as an accidental DDoS on your own network. Even though broadcast storming is a layer 2 issue, it’s going to cause issues up the OSI ladder that will nullify network functionality all the way to layer 7.
Actual footage
So, what causes a broadcast storm? They can be caused by a lot of different things, but normally it boils down to poor hardware (like using hubs in an enterprise environment instead of switches), inexperienced network management, or someone getting a little excited and plugging in some devices where they shouldn’t have. At the end of the day, there’s a layer 2 device plugged into itself, directly or indirectly, and it’s causing you some big problems.
Chasing the Storm
On the surface, a broadcast storm can look like any other severe network outage. However, there are a few ways you can identify if a storm is causing everything on your network to go full Y2K. You’ll need to use a couple handy tools to find this out, and PingPlotter is your first stop.
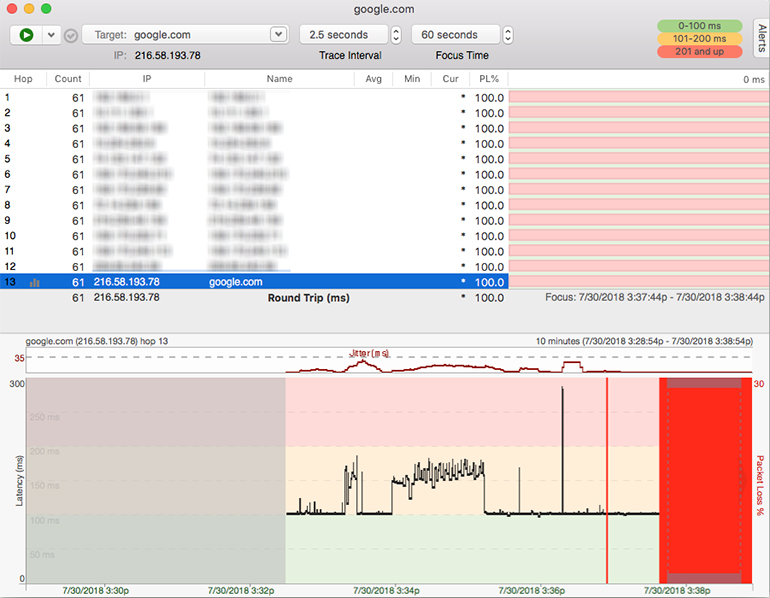
When looking at a PingPlotter trace to any target (internal or external), pretty much everything except your loopback, 127.0.0.1 (home, sweet home), will be red. After you’re done freaking out, right-click the column headers and hit “Errors.” This will bring up a column showing you any networking errors. If you have errors on every hop, you can be sure you’re experiencing an actual network issue and not a simple device outage. You’re now one step closer to identifying a broadcast storm.
Here in the PingPlotter Cave, we made a broadcast storm of our own by plugging one switch into itself to not only capture the mess that ensued but to show just how easy it is to cause such a large, catastrophic issue.
To be more certain of a broadcast storm, we need to use a free tool called Wireshark. Wireshark will basically look at a wire, chomp on its packets, and show you the guts. The reason we need to do this is that our packets are going to have something in them altered on their way back, and we need to take a look at that information to understand what happened in transit.
To get started, make sure your PingPlotter trace is still running. Then, open up Wireshark, select your NIC, and hit “Play” (the green fin up top). Let Wireshark run for about five seconds, then hit stop (the red square up top). You’re probably looking at tons of data now, but don’t worry — we can quickly sift through it to find what we want. Go ahead and type “ICMP” into the top bar (if you’re using our default packet engine), and hit Enter. Then, hit the “Source” column header to sort by source. We are looking for ICMP packets coming from your local IP address to the destination IP address. If you’re in luck, you’ll see something like this:
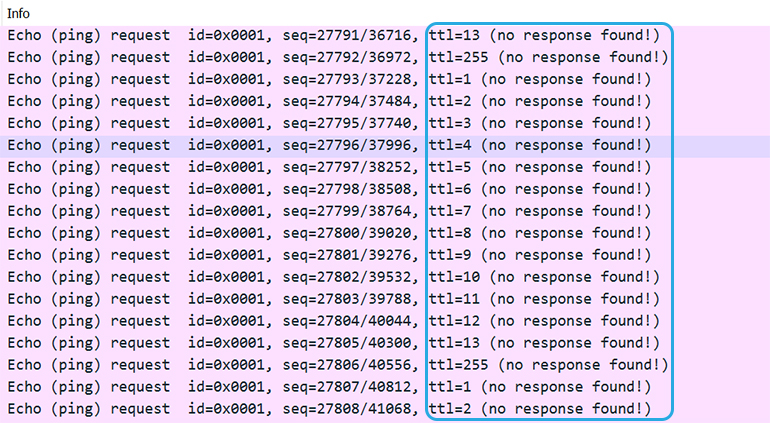
You’ll notice these are all the same color, headed to the same destination with ICMP protocol, and the same packet length. However, if you look closely near the end of the row, you’ll see each has a staggered TTL. This is how you can tell these are PingPlotter packets (we’re tracing to each hop with an ICMP message, decrementing TTLs for each hop). You need to make sure that you’re looking at PingPlotter’s packets so we don’t go on a wild goose chase.
You can also see that after each staggered TTL number, it says “(no response found!)”. Bada bing, bada boom. This means the packets went out into the ether, never to return. Why didn’t they come back? They were too busy spinning around the wicked switching loop. So, if your Wireshark looks like this, you can deduce that you likely have a broadcast storm.
Breaking the Cycle
Now that we’ve narrowed down the issue to broadcast storming, it’s time to take action. The first thing you need to do is to get into every single layer 2 device with more than one layer 1 port and enable some form of Spanning Tree Protocol. This may be vendor-specific, and you need to make sure that you’re using the same version of STP (PVST+, RSTP, etc.) across devices. Furthermore, if you have Cisco devices, enable Loopback Protection on all of them if you can. If you have hardware from other vendors, you’ll want to look up whatever methods of loopback protection and broadcast storm protection they offer and implement it for all devices. It’s important that every device you can configure has the same protocols implemented. Rapid Spanning Tree Protocol is a good vendor-neutral safeguard you should be able to put on all layer 2 devices within your control.
If you don’t see your PingPlotter red clear up after you’ve done everything mentioned above, you’ll have to take your troubleshooting to the meatspace. You’ll need to review your infrastructural diagrams and make sure no switch is connected to itself directly or through another switch. If the diagrams look good, you’ll have to go out to all your switches, hubs, wireless access points, and bridges to inspect what every port is attached to.
Every. Single. Port.
This all is going to come down to you, and since it’s a layer 2 problem requiring layer 1 troubleshooting, there isn't much software out there that can make this easier. You’ll have to use the abounding knowledge in that big ol’ brain, get your hands a little dirty, and give your chair some time to cool down. You’ll also need to be very conscious and detail-oriented (and I hope you like Red Bull).
The best place to start your journey is at the top of the food chain: your ISP uplink. From there, follow each connection down the line while checking your diagram. If you haven’t already, now is a good time to channel your inner obsessive and label everything you can. This includes ports, cable, and anything else you might find useful. Through this process, you should end up finding one of two things: a layer 2 device that’s connected to itself or some APs that might be hard-wired and meshed at the same time. Once you find the endless circle of doom, unplug and replug in a suitable manner that does NOT cause a second loop — dealing with this was rough enough the first time.
At this point, you should be seeing more green than red in your PingPlotter graphs. Your boss is probably pretty proud of you, and so are we. Pat yourself on the back, go get a good night’s sleep, and don’t hesitate to email support@pingman.com if you have any questions.