

How to Keep a Record of Network Performance Over Time
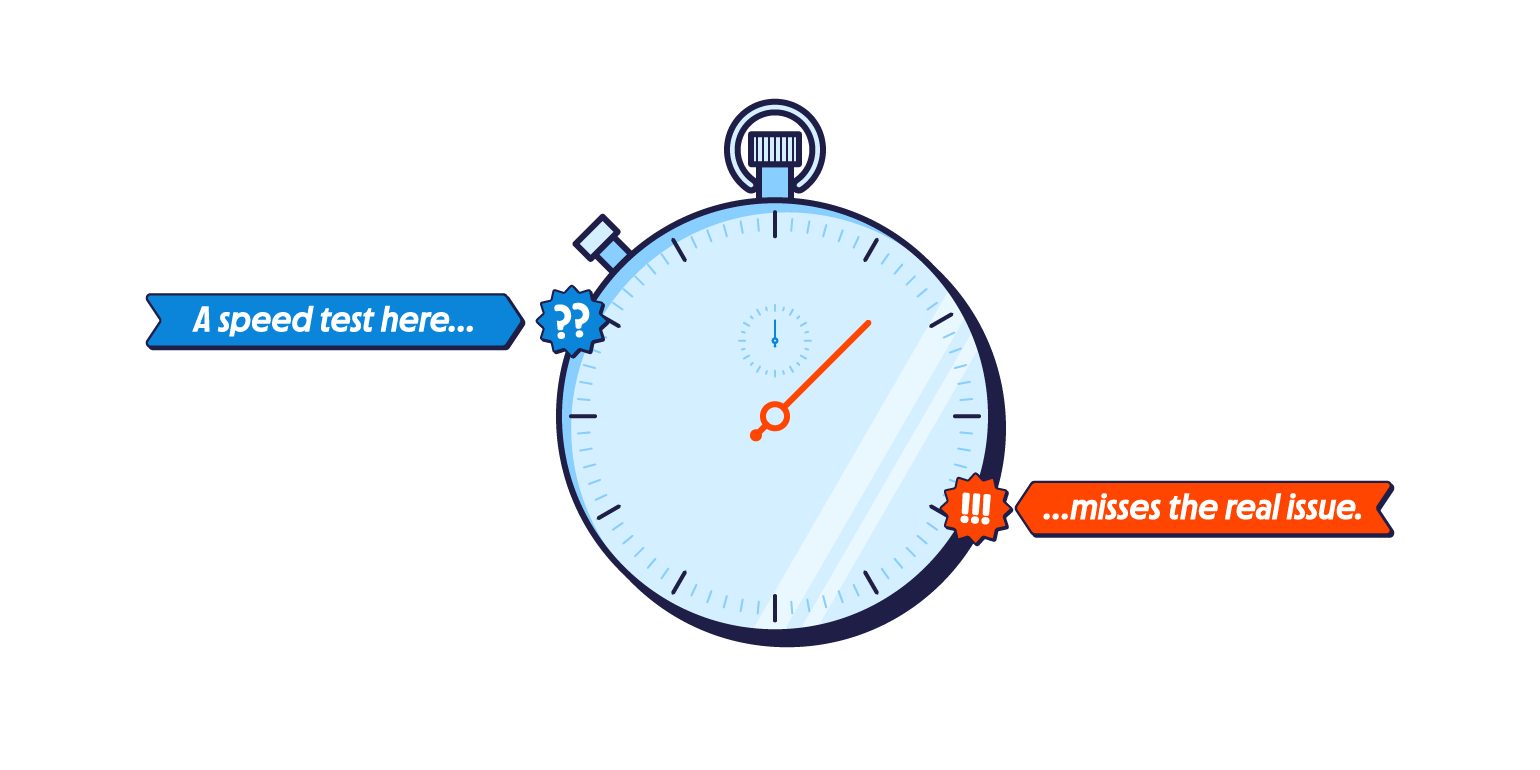
Most internet connection issues happen at irregular intervals and are tough to catch. That means testing the network during a single point in time, like with a speed test , is unlikely to show an accurate representation of network performance.
If you run the speed test at noon, but the problem occurred at 3 a.m., the test results will not show what really happened. PingPlotter tests the connection every second and captures what happens before, during and after internet issues occur. Its historical data creates a detailed record of network performance over time.
A PingPlotter customer, Digitell streams business conferences live on the internet. Obviously, the connection quality can vary from location to location. To ensure high caliber live streams, Digitell tests their network days before a conference and reviews PingPlotter’s historical data. This way, they can identify and prepare for any potential network problems before the live stream begins — minimizing the possibility of downtime.

Ready-to-Rock Benefits
There are many benefits to having historical data readily available:
Performance Check
Historical data provides a comparison point between optimal and poor network performance, letting you know if things are going south. By looking at data trends, you can establish a baseline for performance and establish the significance of an event.
Root Cause Analysis
Without historical data, it’s difficult to determine the root cause of internet slowdowns and downtime. IT teams can spend hours getting to the heart of the issue. However, if you can track a chain of network events and then review the timeline to see which part of the route went bad first, you can fix problems faster.
Network Forecast
To predict the future of your network, you need data from the past that will help confirm trends. For example, the network goes down every day at 11:35 a.m. Historical data will give you a clear picture of why this is happening every darn day. It will also enable you to find network patterns, so you can be ready for the next significant event.
Features that Support Historical Data
Insights
Our network troubleshooting assistant, Insights , automatically detects potential problems, ranks them in order of severity and suggests how to resolve them. You can look through days’ worth of historical data quickly to find incidents and diagnose issues.
Quality Monitor
If you’re monitoring more than a dozen computers, the Quality Monitor dashboard will help you quickly identify who is having internet connection issues and why. Quality Monitor’s historical data also lets you spot network patterns over time. You can zoom in on a certain group of end-users or an individual employee. From there, you can view data for the last hour, last day, last week, last month, or last year.
Timeline, Trace & Summary Graphs
The Timeline graph plots metrics over time and its historical data helps you identify patterns you may not have noticed otherwise. The Trace graph shows the details of your current trace and is updated in real-time. Finally, the Summary graph provides an overview of your traces, letting you compare multiple traces from multiple targets.
Store Data FOREVER
PingPlotter can store as much data as you want for as long as you want. This detailed record of network performance over time helps you solve more complex, evolving problems later.
Get a FREE trial of PingPlotter Cloud and start storing your data today!