Why One Ping Only Tells Part of the Story

Only in Hollywood
In the Hunt for Red October, Sean Connery used echolocation to verify the distance between his submarine and the enemy. It was an epic strategy with the very dramatic line "Give me a ping, Vasili. One ping only, please." And while the crew followed his order, they all thought he was crazy. They knew that one ping would tell them only part of the picture, it would take several pings to calculate the distance, speed, and direction of the enemy. Things you need if you want a torpedo to actually hit something.
So, while it might be fun to sit at the command prompt and ping at one target or another while pretending to be the Russian Captain of a movie from the '90s, don't expect to get the information you need to attack the problem.
Ping the Crap Out of It
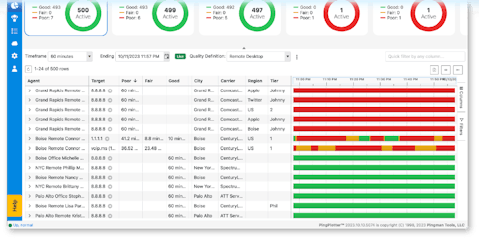
Most tools combine ping and traceroute. We're talking pings, but the terms work interchangeably in this article. Pings do a simple but powerful task. By sending packets of data through computer networks, they track the journey and bring back souvenirs from the trip in the form of diagnostic data. Unfortunately, that data is true only for that one ping. Just like conducting a political poll, if you base your decisions on one voter survey, you are going to get a very incomplete picture. If you want the kind of data that helps you make the right IT decisions or inspires someone else to improve their network, you want every ping you can get and you need a tool that can preserve the results-better yet, a tool that helps you make sense of 900 or 90,000 pings a day. Because let's face it, ain't nobody got time for that.
Why Do I Need so Many Pings?
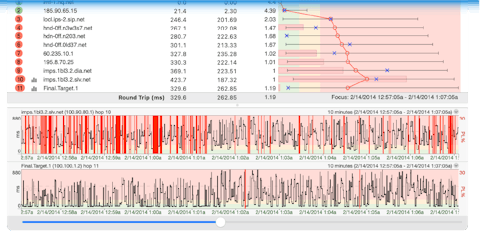
The first, and most difficult, part of fixing a slow or undependable network connection is pinpointing the problem. To get the real picture of latency and packet loss in your network requires you put on your private investigator hat and go on a stakeout. You need to record all performance activity over time and look for evidence of undesirable activity. Programs like PingPlotter handle the stakeout for you. The best part? After collecting all of that data we can visualize the problem. Here is an example of how clearly a bunch of pings can work to solve the puzzle.

When high latency or packet loss starts at a hop and carries through to the final destination, it indicates a network problem. One ping might have told us that we had problems getting packets to and from our destination, but with a crap-load of pings to every hop along the way, we can tell where it is happening and how big of a problem is waiting for us. And it feels so wonderful when you find out that it is someone else's network that sucks and not yours.
Over the years we have learned to identify a ton of network problems. For a less simplified version of what to look for, you can jump over to our knowledge base article on pinpointing the problem.
Tools to Make Network Troubleshooting Suck Less
Collecting network performance data with a computer's built-in ping utility is completely possible, but let's face it, it leaves the hardest parts (storing and visualization) for you to do. Luckily, several free and paid continuous ping tools are readily available. In complete alignment with our bias, we're using PingPlotter to show the concepts we're covering, but if you looked you could probably find something less awesome. You can even find some with such high price tags that your new best friend is going to be a sales consultant. We just have network geeks, so if you need to be talked into more software than you need, Google has a lot of options for you. If you do shop around, these features are must-haves:
- Pings continuously as long as you need it to.
- Graphs metrics over time to help correlate problems.
- Alerts and auto-save to free you from the screen every now and again.
- Installs locally to capture the unique perspective of your device.
What if MY Network Sucks?
Depending on who controls the network you're having trouble with, there are different ways to attack the problem. If the problem exists somewhere you control, the visual graphs will help you find the hardware or network segment that is acting up. It will also make it easy to see when you unplug an offending piece of hardware or tweak a QoS setting that you are on the right path.
What if I Have to Tell a Provider THEIR Network Sucks?
In situations where someone else controls the problem network, the path to a solution runs through tech support. Yeah, that path is not an easy one. Tech support is naturally skeptical of the sad stories brought to their headsets because new problems mean more work. The tedious steps of their support flowchart can make the most stable people consider ending it all. Enlisting their help requires a compelling case. By continuously monitoring the problem with a graphical trace tool, you have the advantage.
Statistical Significance
Aside from exposing their position, the risk of Red October's single ping was false positives. More pings showing similar results increase confidence in the sonar's output, and the same concept applies to network troubleshooting. A single ping showing high latency or packet loss does nothing more than suggest poor performance happened at a certain point in time. Networks aren't perfect and a single data point is easy for tech support to dismiss as an anomaly. Repeatedly testing the network and finding consistent results increases confidence in the existence of a problem. This concept is called statistical significance, and it essentially asks whether an event happens often enough in a given number of tests to rule out random chance.
Correlation
If your case reaches a point where you can say something to the effect of "When this happens. I see this happen to network performance metrics." You've found the kind of golden nugget that moves support tickets up the food chain. Some examples could be:
- "Uploads to the cloud take forever when packet loss shows consistently between hop 4 to the final destination."
- "Latency is four times the average when my online game experiences crippling lag."
- "Sonar shows a large object in front of our location when my sub is unable to move forward."
- "When latency and packet loss spike, my broadband call quality deteriorates."
Establishing cause and effect between network performance data and real events helps verify the diagnosis and puts you in a position to recreate the problem for tech support.
Comparisons to Good Performance
It’s a lot easier to demonstrate how bad performance has become when you have documentation of what good performance has looked like in the past. Information about good performance strengthens cases by communicating the severity of problems. Seeing only bad performance leaves the degree of "badness" open to interpretation, and tech support usually interprets in the direction of less work.
Submarine Warfare and Network Troubleshooting - Not so Different After All
Continuously pinging better informs you about the environment whether you're locating obstacles in the briny depths or hunting the source of network nightmares. And while our knowledge of nautical battle tactics is limited, we're constantly adding to a treasure trove of network troubleshooting wisdom. If you are ready to ping the crap out of your network problems we have an always-free edition of PingPlotter and a ton of great knowledge base articles online at www.PingPlotter.com.

