

The Difference Between Latency & Packet Loss

If you don't know what you're looking for, it's easy to be mislead by latency and packet loss data. Following the interpretation guidelines described here helps ensure you're chasing the right problems. In case you're unfamiliar with these metrics, we'll start with some basic definitions and expand from there.
Network latency is a measurement of round trip time (RTT) for a packet of data, or the number of milliseconds it takes a packet to travel to a destination (server) and back again.
When packets of data fail to reach their destination, your network is experiencing packet loss. Packet loss is expressed as a percent. For example, if 91 of 100 packets reach their destination the network experienced 9% packet loss.
The final destination is most important
If the final hop is showing 0% packet loss and acceptable latency, you can ignore whatever you see in the hops leading up to it. In example 1, we see scary looking packet loss early in the route, but performance looks good at the final destination. We can ignore patterns like this.
A common cause of non-continuing packet loss is a router with low priority for timed out ICMP requests (ICMP requests where the TTL equals 0 after reaching them). Other possible causes for this are described in the PingPlotter Knowledge Base, but the most important takeaway here is this type of information does not indicate a problem.
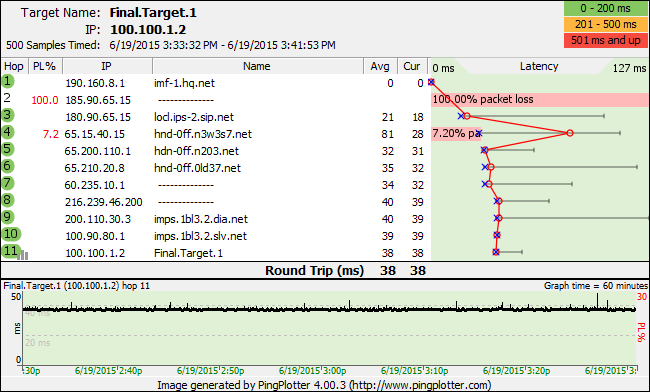
E.G. 1: Ignore packet loss that does not continue to the final hop
Consider other hops after destination hop issues are discovered
In example 2, we see high packet loss and latency at the final destination. This is your cue to inspect the rest of the route. Here we can trace poor performance all the way back to hop 4.
Patterns like this are what you should be looking for. When bad performance starts somewhere in the route and carries through to the final destination it suggests the problem begins with the first hop showing bad performance.
The case for a problem is further strengthened when you can correlate data with some event. Maybe you see output like this when you upload a large file. Better correlation creates better evidence for your case, and we dive a little deeper into this concept in our Pinpointing the Problem article.
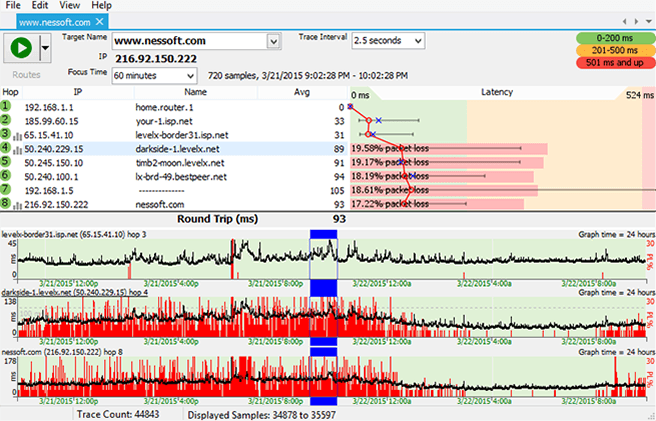
E.G. 2: Track the problem back to its origin when the final hop is effected
Distance increases latency
Like other travel related measurements, latency is affected by the distance separating points A and B. With this in mind, the location of target servers should be taken into account when deciding whether or not your network experiences unacceptable latency.
If you feel like getting fancy with expected latency estimations, try controlling for travel time by subtracting speed of light * distance from latency. More information about this topic and examples are available in the PingPlotter Knowledge Base.
Any packet loss signals a problem
Internet protocols are designed to correct some amount of packet loss, but anything over 2% usually effects network performance in a negative way.
When interpreting network performance data, keep in mind the final hop must be effected for anything else to matter. Anything you see that does not carry through to the final hop in the route was sent as a distraction by the demons of bad networking mamba jamba.